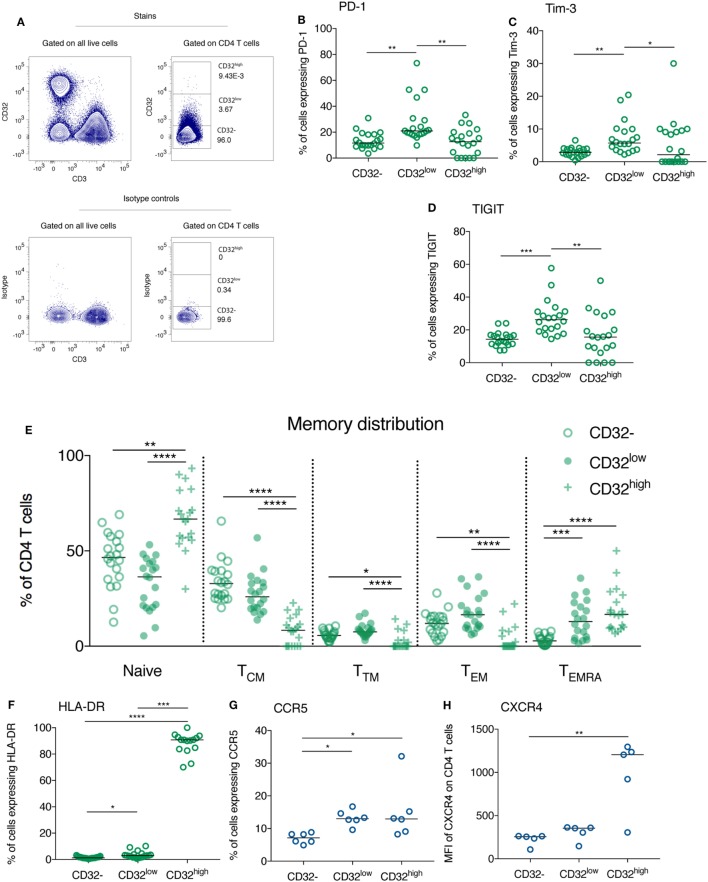
Figure 3.
CD32-expressing CD3+CD4+ cells differ in their expression of immune checkpoint receptors, the activation marker HLA-DR and HIV co-receptors, as well as their memory phenotype. Representative gating of CD32-expressing populations on CD4 T cells from an HIV+ individual is shown (top panel) in panel (A), relative to isotype control (bottom panel). CD32−, CD32low, and CD32highCD3+CD4+ T cell populations were compared with regards to their expression of programmed death receptor-1 (PD-1) (B), Tim-3 (C), TIGIT [(D); all n = 20], and HLA-DR [(F), n = 19]. For panel (F), four samples were excluded from the analysis of the CD32high population because there were five or fewer events. These same populations were compared with regards to their memory phenotype. The percentage of each population composed of naïve (CD45RA+CCR7+), central memory (TCM; CD45RA−CCR7+), transitional memory (TTM; CD45RA−CCR7−CD27+), effector memory (TEM; CD45RA−CCR7−CD27−), and TEMRA cells (CD45RA+CCR7−) was quantified by flow cytometry and is shown in panel (E) (n = 20). The comparisons are all shown in HIV+ individuals at 1 year following the initiation of antiretroviral therapy. The expression of HIV co-entry receptors CCR5 [(G); n = 6] and CXCR4 [(H); n = 5] was compared between CD32−, CD32low, and CD32highCD3+CD4+ T cell populations in healthy individuals. Throughout, a Kruskal–Wallis test was used to compare all three groups; pairwise comparisons were performed on all combinations of groups only if the overall test p-value was < 0.05; ****p < 0.0001, ***p = 0.0001–0.001, **p = 0.001–0.01, *p = 0.01–0.05; for ease of interpretation if p ≥ 0.05 for any comparison this is not shown on these plots.

