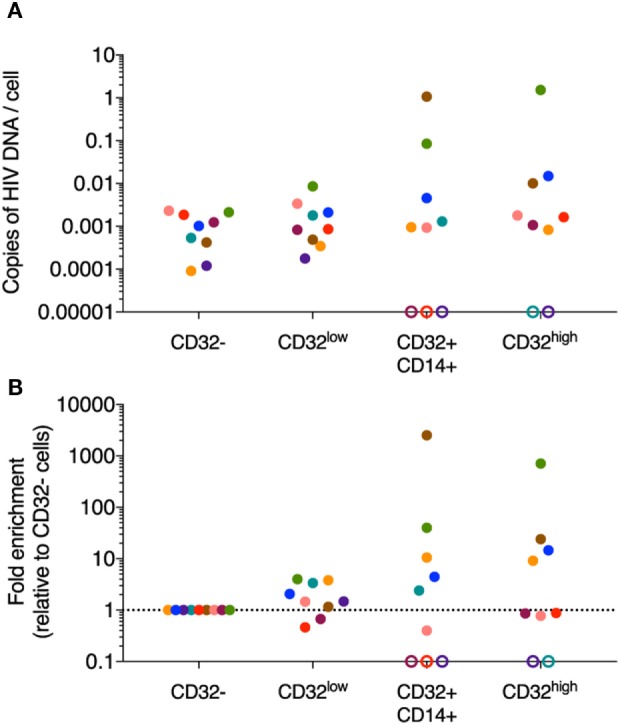
Figure 4.

HIV DNA quantification in sorted CD32-expressing CD3+CD4+ T cell populations. HIV DNA was quantified in sorted CD32−, CD32low, CD32+CD14+, and CD32high CD3+CD4+ T cell populations by qPCR (n = 9). (A) Shows the absolute quantification of these data and (B) shows the fold change relative to the CD32− population. Copies of HIV-1 DNA were quantified and normalized to number of input cells (as determined by albumin PCR). PCR reactions for both albumin and total HIV were performed in triplicate for the CD32− population and in duplicate for the remaining three populations. Data shown are averages of the replicates. Data points are colored by the individual from which the population was sorted. Where no signal was detectable for a given sorted population, this is shown as an open circle on the axis. For all of these undetectable populations, we could not determine if they were in fact negative for HIV DNA as the predicted level of infection (assuming equivalent level of infection to the CD32− fraction) was below the level of detection of our assay based on the available input cell equivalents.
