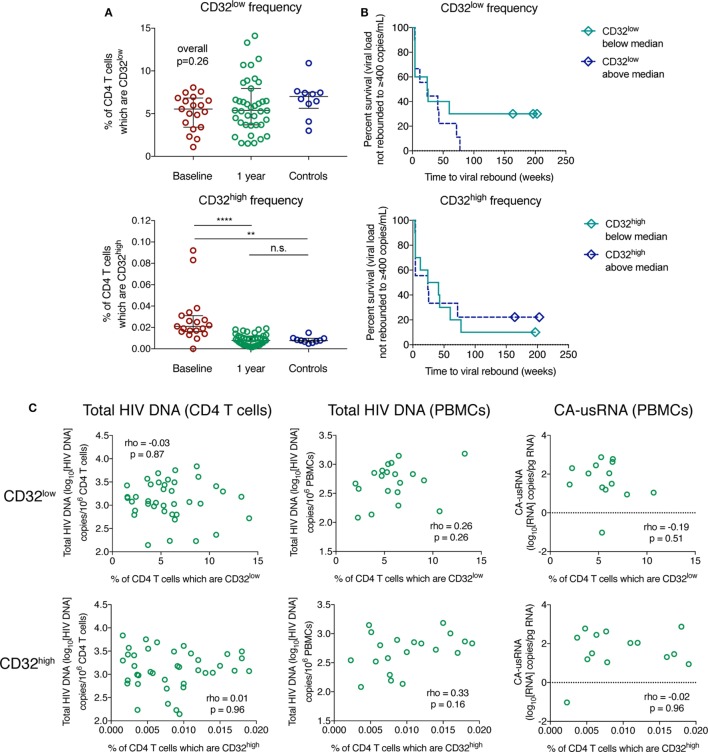
Figure 5.
The frequency of CD32-expressing CD3+CD4+ cells does not correlate with the size of the HIV reservoir. The percentage of CD32low (top panel) and CD32high (bottom panel) CD3+CD4+ cell populations is shown in panel (A) for HIV+ individuals with primary HIV infection pre-therapy (baseline; n = 19) and 1 year following antiretroviral therapy initiation (n = 39), as well as for controls (n = 10); groups were compared using a Kruskal–Wallis test. Bars indicate the median with the interquartile range. Panel (B) shows survival curves (Kaplan–Meier) of time to viral rebound >400 copies/mL based on the frequency of CD32low (top panel) and CD32high (bottom panel) CD3+CD4+ cells stratified at the median (n = 19). The relationship between measures of the HIV reservoir and percentage of CD32low (top panels) and CD32high (bottom panels) CD3+CD4+ cells in treated HIV+ individuals, shown in panel (C), was assessed using Spearman’s rank correlation. Left column shows total HIV DNA measured in isolated CD4 T cells (n = 39), the center column is total HIV DNA measured in peripheral blood mononuclear cells (PBMCs) (n = 20), and the right column shows cell-associated unspliced HIV RNA (n = 14); ****p < 0.0001, **p = 0.001–0.01, n.s. (not significant) indicates p ≥ 0.05.

