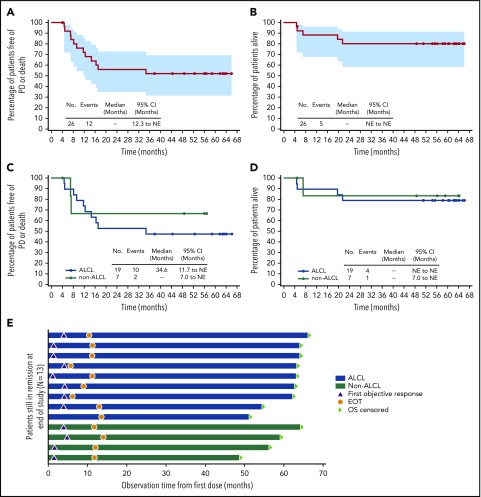
Figure 1.
Five-year durability results. PFS and OS were analyzed using Kaplan-Meier methodology and are shown for the overall population (A-B) and by disease subtype (ALCL vs non-ALCL; C-D). All censored patients are indicated by dots on the Kaplan-Meier curves. One patient in remission (angioimmunoblastic T-cell lymphoma) did not enter long-term follow-up, withdrew consent, and was censored after 4.1 months. (A–B) Shading indicates the 95% confidence bounds. (E) Observation time for the subset of 13 patients in long-term follow-up remaining in remission with no subsequent anticancer therapy through end of study; all 13 achieved CR. Shading indicates disease subtype (ALCL vs non-ALCL). EOT, end of treatment; NE, not estimable; PD, progressive disease.

