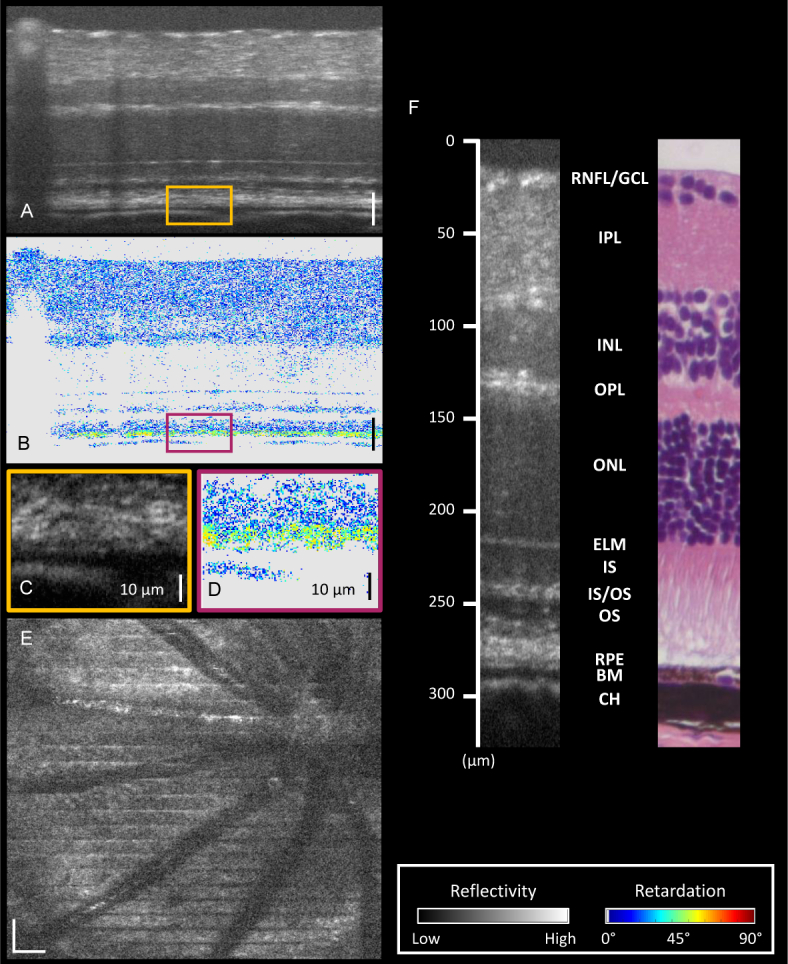
Fig. 4.

(a) Reflectivity image acquired by the white light PS-OCT system. (b) Corresponding phase retardation image. Most of the healthy murine retina is polarization preserving. (c) Zoomed in region indicated by the orange box in (a). The depolarizing RPE is difficult to distinguish from its surrounding layers. (d) Zoomed in region indicated by the purple box in (b). High resolution PS-OCT highlights the depolarizing RPE. (e) An en-face projection of a region of a healthy mouse retina including the optic nerve head (ONH). (f) A section of a mouse retina as measured with white light OCT, and a histology image of a similar area from a different mouse. Depth positions are marked and retinal layers are labeled. RNFL Retinal nerve fiber layer. GCL Ganglion cell layer. IPL Inner plexiform layer. INL Inner nuclear layer. OPL Outer plexiform layer. ONL Outer nuclear layer. ELM External limiting membrane IS Inner segments. IS/OS Inner segment/outer segment junction. OS Outer segments. RPE Retinal pigment epithelium. BM Bruch’s membrane. CH Choroid. All scale bars correspond to 50 µm unless otherwise stated. Color maps for reflectivity (grayscale) and retardation (colored) can be found on the bottom right. Pixels which appear gray in the retardation images indicate that the retardation value was not calculated as the SNR was not high enough.
