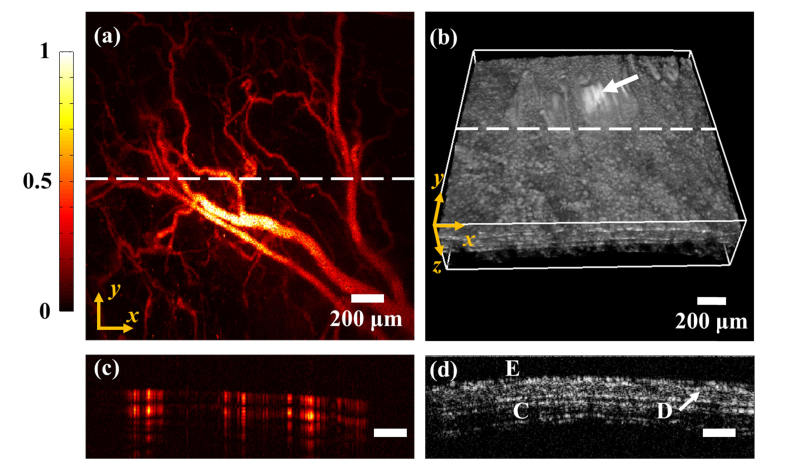
Fig. 4.
Dual modality imaging results of a mouse ear. (a) The maximum amplitude projection (MAP) image of the mouse ear (ORPAM). (b) The 3-D rendering of the mouse ear (OCT). (c) A typical ORPAM B-scan along the white dotted line in (a). (d) A typical OCT B-scan along the white dotted line in (b), E, epidermis; D, dermis; C, cartilage.

