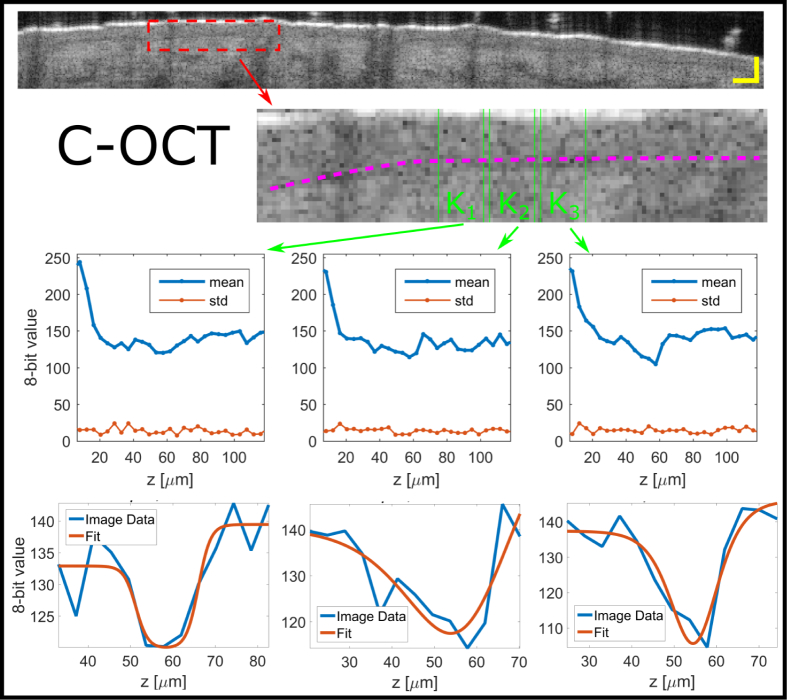
Fig. 4.
C-OCT system: DEJ evaluation for central B-scan of the cheek of HP 2 (top image), scale bar representing 100 μm. A ROI is selected (dashed rectangle) of which a zoom-in is presented (bottom image). Within the zoom-in three subsets (K1, K2 and K3) are emphasised (green vertical lines) and a guide to the eye of the DB propagation through the skin (purple dashed) is given. The subsets, comprising each ten A-scans and representing regions of constant axial DEJ position, are averaged laterally (horizontally in image) to accentuate the DEJ from the speckle noise providing three graphs with means and stds (top graphs). A double sigmoid fitting (bottom graphs) is performed for each average to extract DEJ information.

