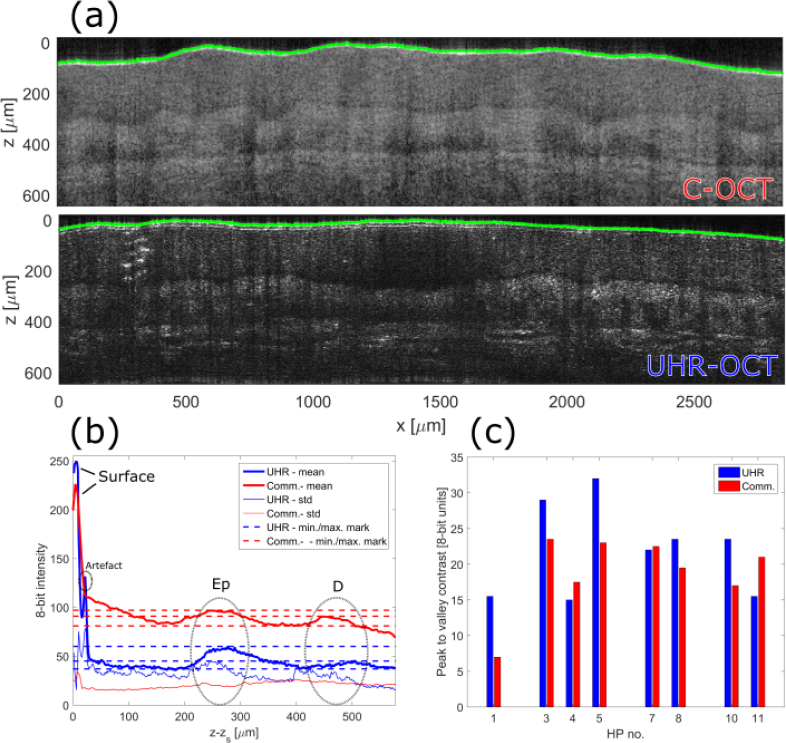
Fig. 6.
(a): OCT images from HP 7 of the hand palm generated with the C-OCT and the UHR-OCT system with the green delineations marking the surface tracing performed. (b) Image signal average along ’x’ relative to the surface trace. The horisontal dashed lines mark the signal readings of Ep, DEJ and D utilised for computing the Ed-D contrast. (c) presents the Ep-D contrasts calculated for central B-scans each associated with a HP volume scan. HP 2, HP 6 and HP 9 are excluded due to significant deviations in the DEJ relative position in the scans caused by special skin features.

