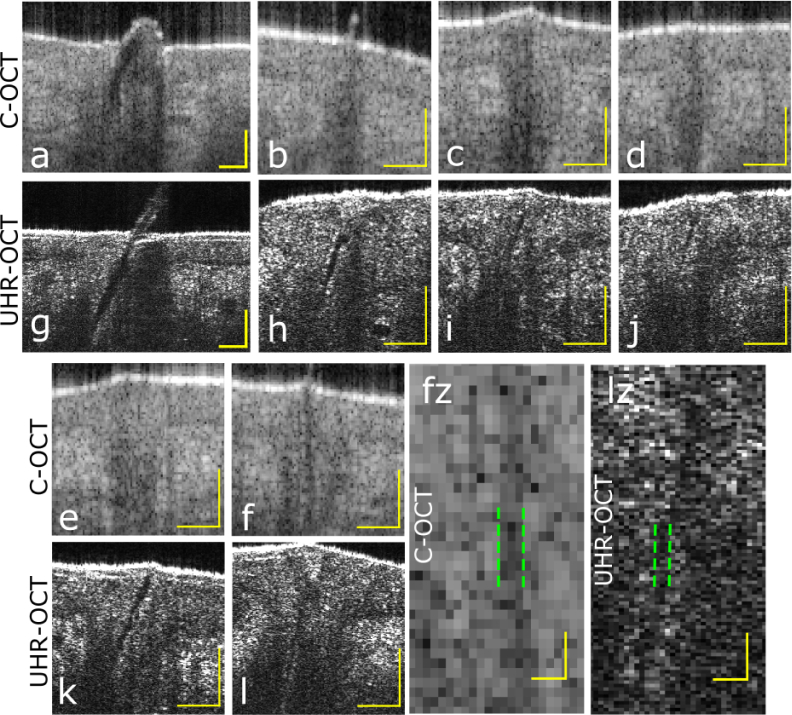
Fig. 12.
Imaging of smaller and larger hairs on cheek of HP 4 comparing C-OCT and UHR-OCT systems. In images a–f and g–l hair follicles are located, each with scale bars representing 100 μm. a and g show larger hairs. fz and lz are zoom-ins of f and l, respectively, and pairs of vertical dashed green lines mark hair-to-surroundings bounderies, each pair enclosing three rows of pixels. Scale bars in fz and lz represent 20 μm.

