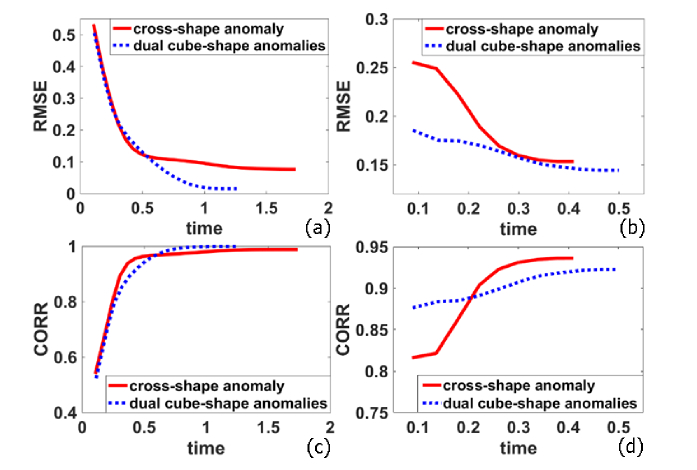
Fig. 6.
Time-course RMSE (a and b) and CORR (c and d) values calculated from the reconstructed images. The outcomes were derived from the g1(τ) data without noise (a and c) and with noise (b and d). In all sub-figures, the red solid curve denotes the outcomes of cross-shaped anomaly, and blue dotted curve denotes those of dual cube-shape anomalies.

