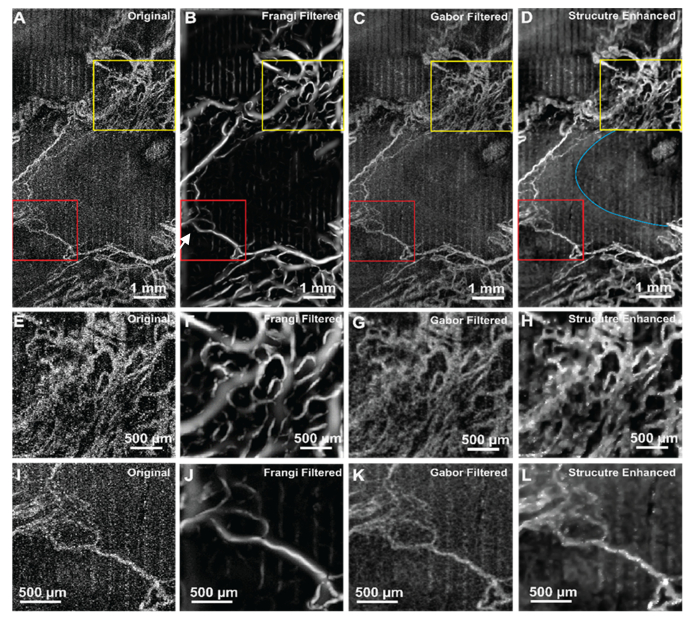
Fig. 5.
Application of the MBRT to OCTA image of rat tumorous brain. (A-D) Original image, Frangi filtered, Gabor filtered and proposed structure enhanced images. The view of interested is labelled in yellow and red rectangles and magnified to (E-H) and (I-L) respectively. Blue curved line labels the boundary of a cyst region.

