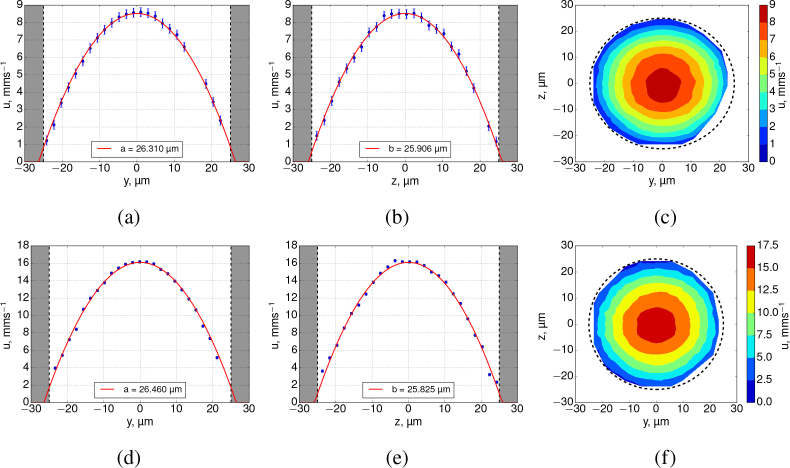
Fig. 5.
SPIM-μPIV analysis results of FEP tube experiments in locations of peak flow, from analysis of fluorescence imagery. Top row - 0.5 μl/min nominal flow rate beads, bottom row - 1 μl/min beads. Shaded area represents tube walls. The profiles of the u-components of velocity in xy (a,d) have very similar shapes for all experiments (semi-minor axis ranges ≈26.3 – 26.5 μm). Similarly, the xz planes (b,e) show similar profile shape (semi-major axis ranges ≈25.9 – 25.8 μm). This confirms that there is no significant anomalous bias to the flow profile recovered in the xz plane, thus validating our use of SPIM-μPIV for 3D flow mapping. (c,f) show colormaps of the velocity magnitude in the yz plane, confirming that to a good approximation the reconstructed flow is circularly symmetric and Poiseuille-like. Dashes show a diameter of 50 μm.

