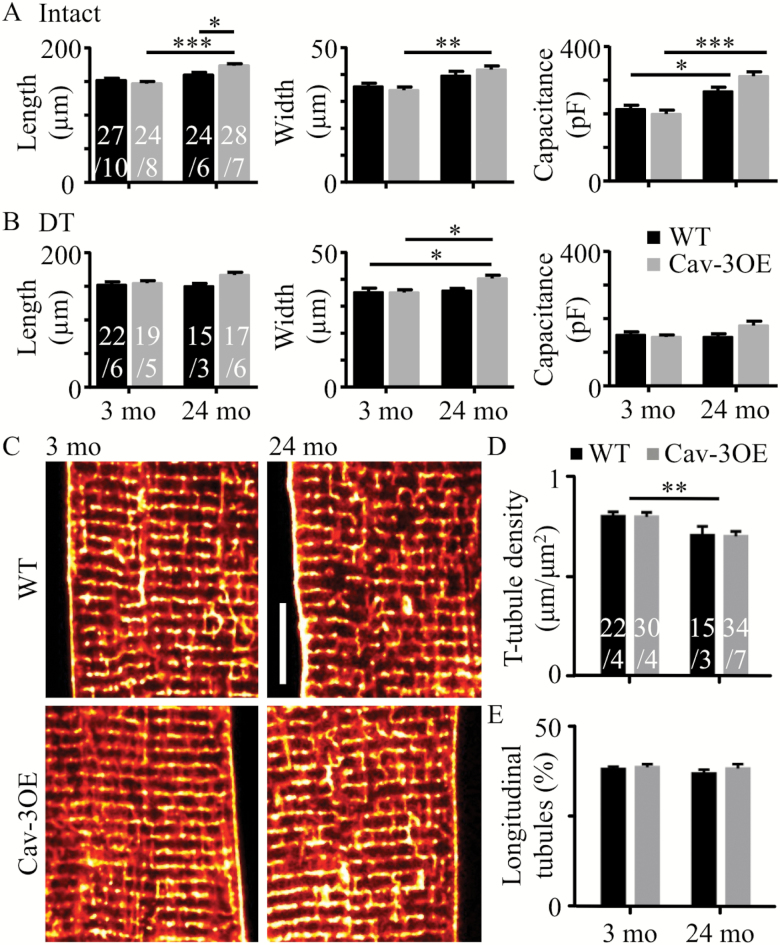
Figure 1.
Effect of age and Cav-3 over-expression on cell size and t-tubule organization. (A) Mean cell length, width and capacitance measured in intact myocytes from wild-type (WT) (black bars) and Cav-3OE (gray bars) mice at 3 months and 24 months of age. Two-way analysis of variance (ANOVA) (age, genotype) tests yielded results as follows. Length: age p < .001, genotype ns, interaction p < .01. Width: age p < .001, genotype ns, interaction ns. Capacitance: age p < .001, genotype ns, interaction p < .05. (B) Corresponding data from detubulated (DT) myocytes. Length: age ns, genotype p = .03, interaction ns. Width: age p = .027, genotype ns, interaction ns. Capacitance: age ns, genotype ns, interaction p = .049. Asterisks indicate *p < .05, **p < .01, and ***p < .001 (Bonferroni corrected post-hoc test). n/N indicated on bars. (C) Representative confocal images of t-tubules labeled with di-8-ANEPPs. Scale bar shows 10 μm. (D) Mean t-tubule skeleton density. (E) Mean percentage of t-tubules that were oriented along the long-axis of the cell (“longitudinal”). Asterisks and n/N as in A and B.

