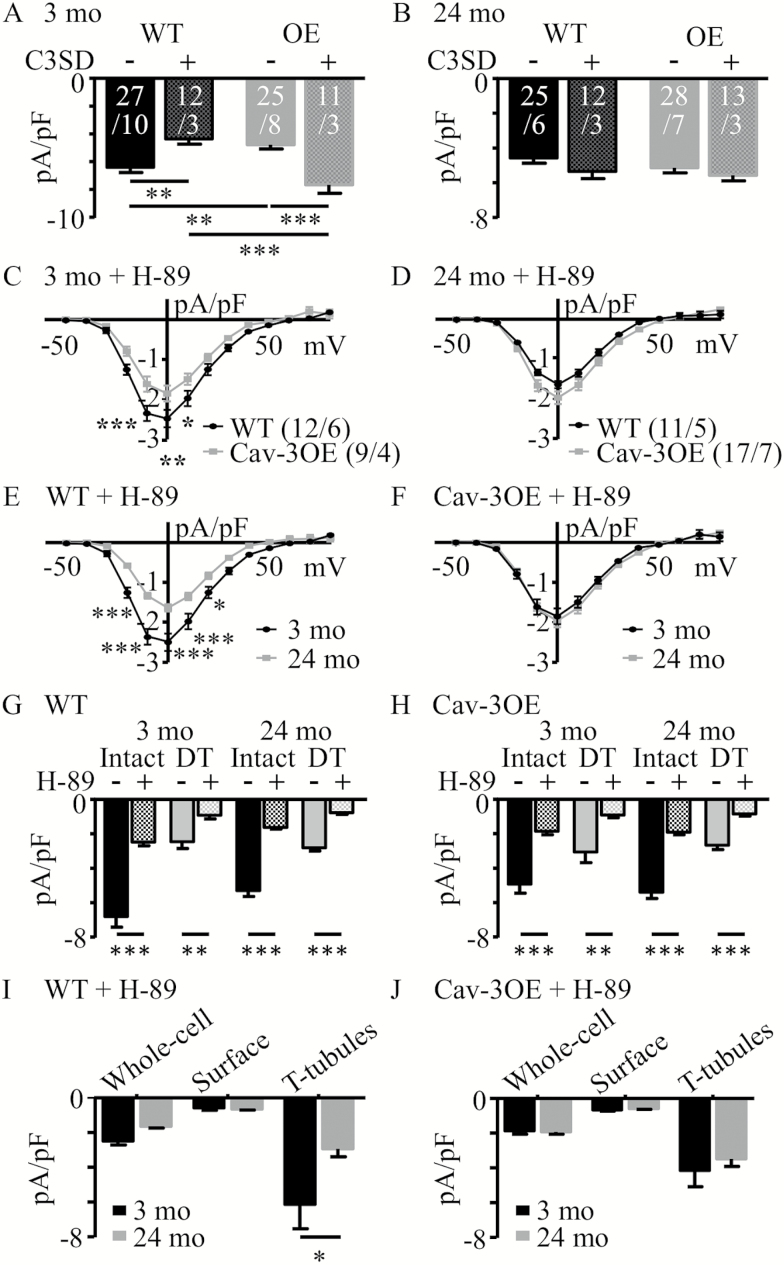
Figure 3.
Effect of inhibition of Cav-3 and PKA on ICa density in 3- and 24-month myocytes. (A) Mean ICa density at 0 mV in the absence (−) and presence (+) of C3SD peptide in wild-type (WT) and Cav-3OE myocytes for myocytes from 3-month-old mice (two-way ANOVA: C3SD ns, genotype ns, interaction p < .001). (B) Corresponding data for 24-month-old mice (two-way ANOVA: C3SD ns, genotype ns, interaction ns). **p < .01 and ***p < .001 Bonferroni corrected post-hoc test. White text on bars in A and B represent sample sizes (n/N). (C) Mean ICa density-voltage relationships recorded in the presence of H-89 from intact 3-month WT (black circles) and Cav-3OE myocytes (gray squares). Two-way repeated measures analysis of variance (RM ANOVA): voltage p < .001, genotype p < .05, interaction p < .001. (D) Corresponding data for 24-month myocytes. Two-way RM ANOVA: voltage p < .001, genotype ns, interaction p < .01. (E and F) Data presented in C and D, rearranged to compare within (E) WT (two-way RM ANOVA: voltage p < .001, age p < .001, interaction p < .001), or (F) Cav-3OE (two-way RM ANOVA: voltage p < .001, age ns, interaction ns) mice. (G, H) Effect of PKA inhibition on mean ICa density at 0 mV in the absence (−, from Figure 2) and presence (+) of H-89 measured in intact or DT cells from 3-month and 24-month WT (G) and Cav-3OE (H) mice. Sample sizes for intact cells/hearts in control solution and in the presence of H-89 are provided in Figures 2 and 3, respectively. For DT myocytes, n/N were: WT 3 month = 8/3; 24 months = 6/3; Cav-3OE 3 months = 7/2; 24 months = 7/2). *p < .05, **p < .01, and ***p < .001, Bonferroni corrected post-hoc test. (I) Calculated ICa density at 0 mV for the whole cell, surface, or t-tubular membranes in WT myocytes in the presence of H-89. (J) Corresponding data for Cav-3OE myocytes. *p < .05, **p < .01, and ***p < .001, Student’s t test.

