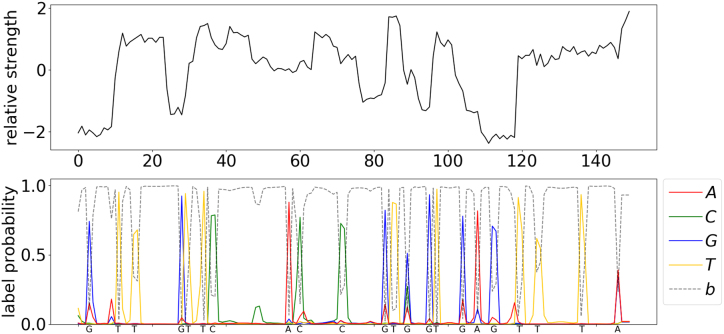
Figure 2:
Visualization of the predicted probability of bases and the readout sequence. The upper panel is a normalized raw signal from the MinION nanopore sequencer, normalized by subtracting the mean of the whole signal and then dividing by the standard deviation. The bottom panel shows the predicted probability of each base at each position from Chiron. The final output DNA sequence is annotated on the x-axis of the bottom plane.

