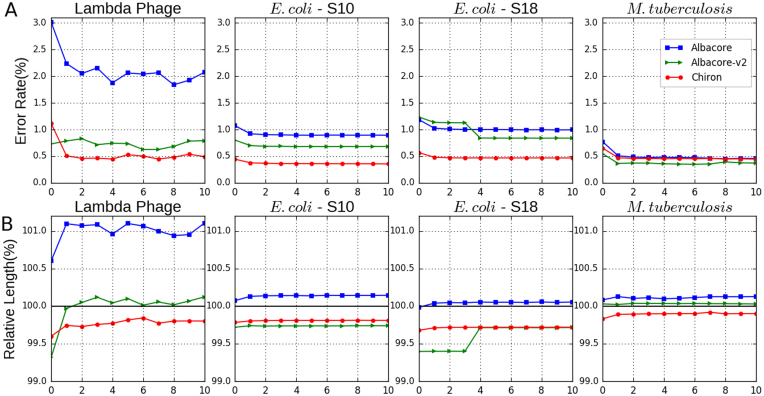
Figure 3:
(A) Assembly error rate (%) for each polishing round using Racon. Two individually sequenced E. coli samples are included (S10, S18). All basecallers have a similar performance on the M. tuberculosis dataset due to its high sequencing depth (130X). (B) Relative assembly length (%) after each round of polishing. Relative length is defined as the length of the assembly divided by the length of reference genome.

