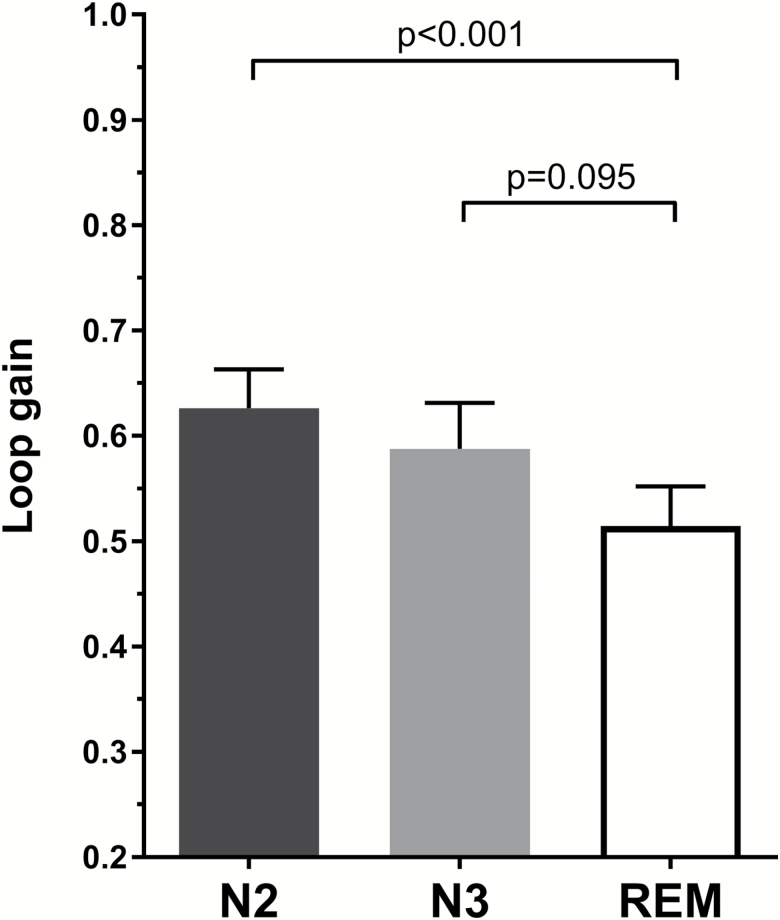
Figure 1.
Sleep state differences in loop gain. Bars represent mean loop gain values for N2 sleep (black), N3 sleep (grey), and REM sleep (white). Error bars represent standard error of the mean. In 21 individuals with sufficient measurements in each sleep stage, loop gain is significantly lower in REM sleep compared with N2 (p < 0.001), but not N3 sleep (p = 0.095). N2 and N3 loop gains did not significantly differ (p = 0.259).

