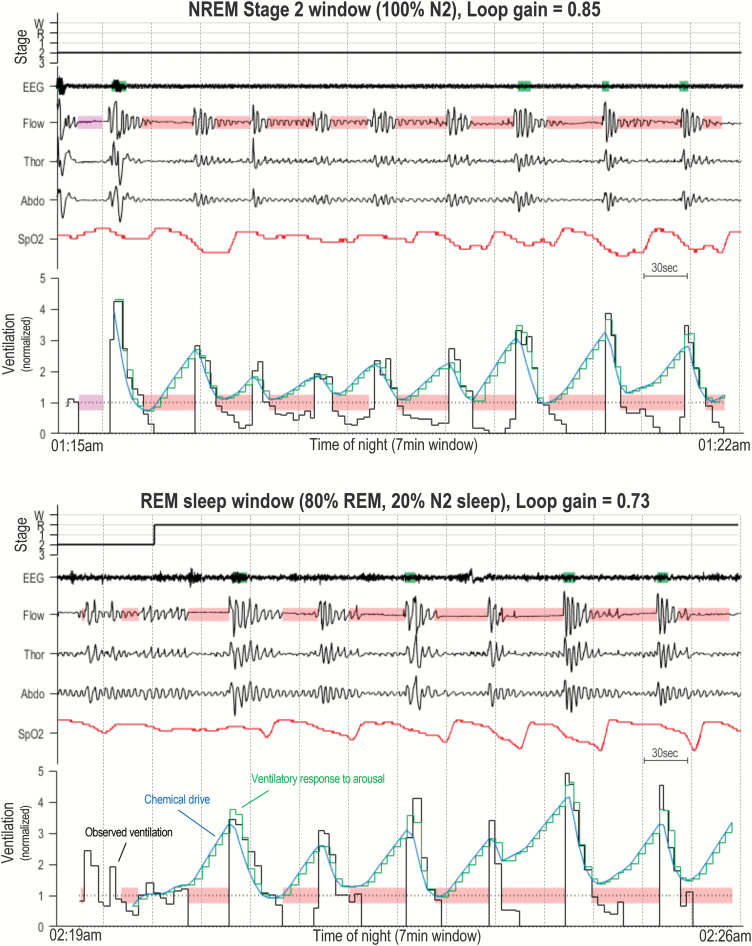
Figure 3.
Example data showing NREM stage 2 and REM dominant analysis windows. Top window shows example data from a N2-dominant period which yields a loop gain estimate of 0.85. Bottom window shows a REM dominant period which yields a loop gain estimate of 0.73. Both windows are composed of the following traces: sleep stage hypnogram (W = Wake, R = REM, 1 = N1, 2 = N2, and 3 = N3), EEG (electroencephalograph), Flow, Thor (Thoracic excursions), Abdo (Abdominal excursions), SpO2, and Ventilation. Shaded green rectangles (superimposed on EEG trace) denote scored cortical arousals. The ventilation trace shows breath-by-breath ventilation measurements in black (Observed ventilation) which are normalized by the mean (1 = eupnea). The overlaying blue line depicts the estimated chemical drive and the green stair-case line shows the estimated ventilatory drive. The blue and green lines are equal during all nonarousal breaths, during arousal a “ventilatory response to arousal” is added to chemical drive. Shaded red rectangles denote obstructive events (apneas or hypopneas), shaded pink rectangles show central events. Each window is 7 min in duration, and 30 s sleep epochs are show by dotted lines.

