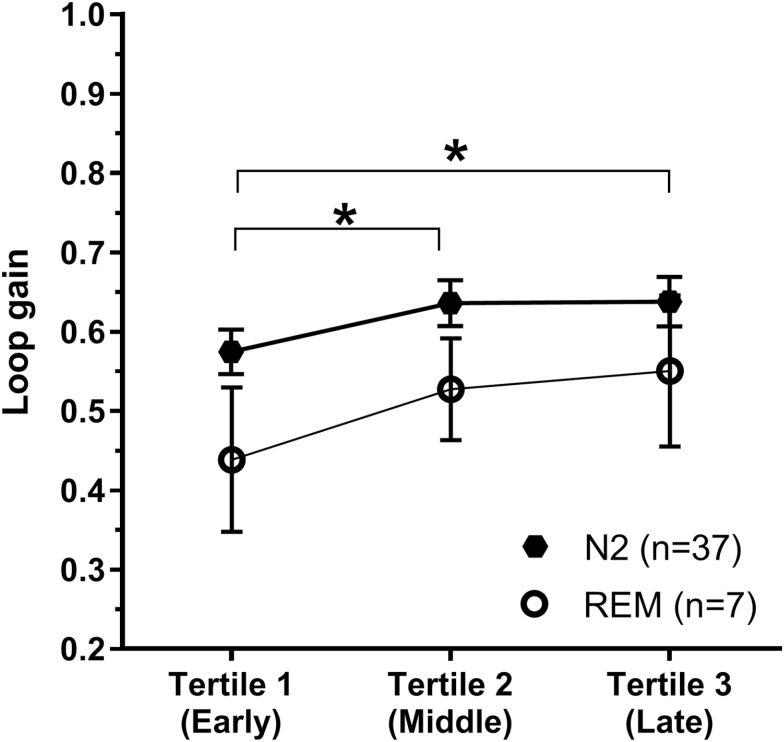
Figure 5.
Changes in loop gain across the sleep period. N2 loop gain values are represented by black hexagons and REM loop gain values by white circles. Averaged loop gain in the first sleep period tertile is found to be significantly lower than tertiles 2 (p = 0.012) and 3 (p = 0.012) for N2 sleep. A similar trend is found in REM sleep; however, this is not statistically significant (p = 0.09). Error bar represents standard error of the mean.

