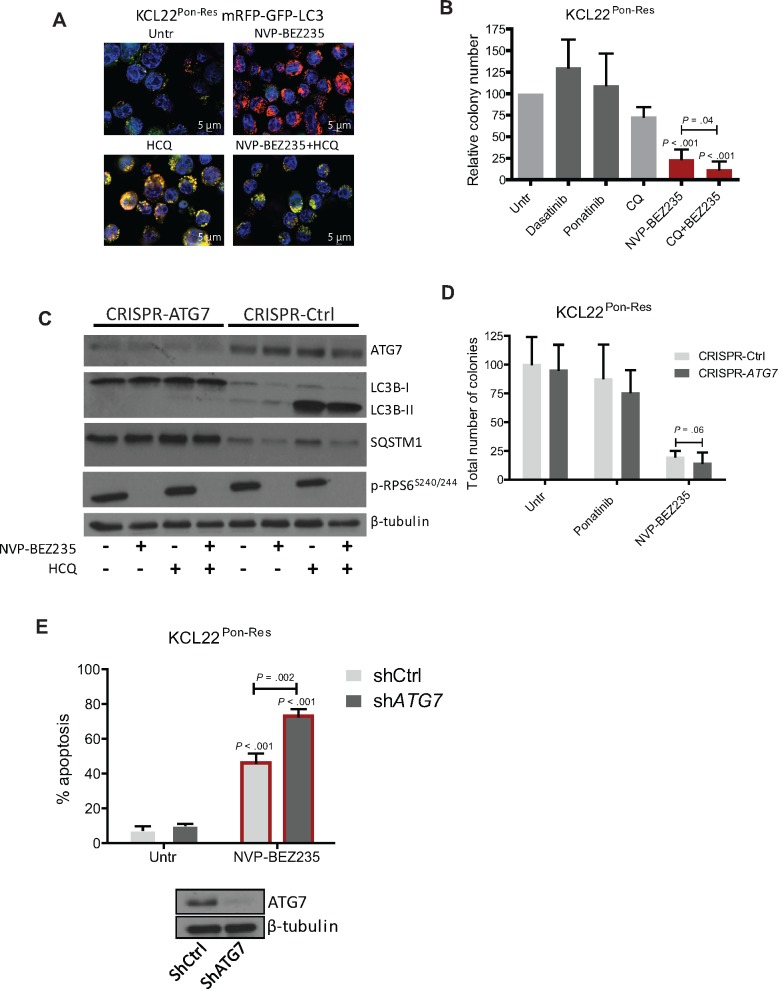
Figure 5.
Autophagic response following mTOR inhibition in ponatinib-resistant cells. A) KCL22Pon-Res cells expressing mRFP-GFP-LC3 were cultured ± 100 nM NVP-BEZ235 alone (top panel) or in combination with 10 µM hydroxychloroquine (HCQ; bottom panel). Scale bars = 5 µm. Autophagy flow (top panel) and inhibition of autophagy flow (bottom panel) was visualized following 24 hours of drug treatment. B) KCL22Pon-Res cells were cultured ± 150 nM dasatinib, 100 nM ponatinib, and 100 nM NVP-BEZ235 with and without chloroquine-mediated autophagy inhibition. Colony forming potential was measured following 72 hours of drug treatment. C–E) KCL22Pon-Res cells were infected with lentivirus-expressing sgRNA (C and D) or shRNA-targeting (E)ATG7 or empty vector/scrambled (Scr) shRNA as control. Following knockdown, cells were treated with 100 nM ponatinib (D), 100 nM NVP-BEZ235 (C–E) alone, or in combination with 10 µM HCQ (C). C and E) Stable ATG7 knockdown, inhibition of autophagy (LC3-II and SQSTM1 levels), and mTORC1 activity were measured in puromycin-selected cells by immunoblot. Colony forming potential (D) or apoptosis (E) was measured following 72 hours of drug treatment. Error bars = SD. Statistical analysis was performed using the two-tailed Student’s t test. CQ = chloroquine; Untr = untreated.

