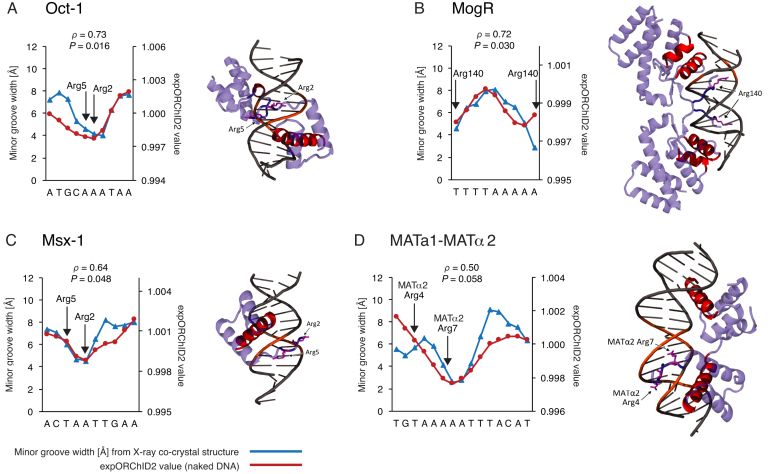
Figure 3.
For some protein–DNA complexes, the pattern of minor groove width variation is similar to that of the same sequence as naked DNA. Patterns were quantitatively compared by computing the Spearman's rank correlation coefficient ρ and the P-value for the similarity. The y-axis scale for expORChID2 values differs slightly between plots to facilitate comparison of individual patterns. This does not affect the calculation of the Spearman's rank correlation coefficient (see Materials and Methods). Red filled circles, expORChID2 values; blue filled triangles, minor groove width measured from the protein–DNA complex. Arrows, locations of arginine residues bound to the minor groove in the protein–DNA complex, for reference. (A) Oct-1; (B) MogR; (C) Msx-1; (D) MATa1-MATα2.

