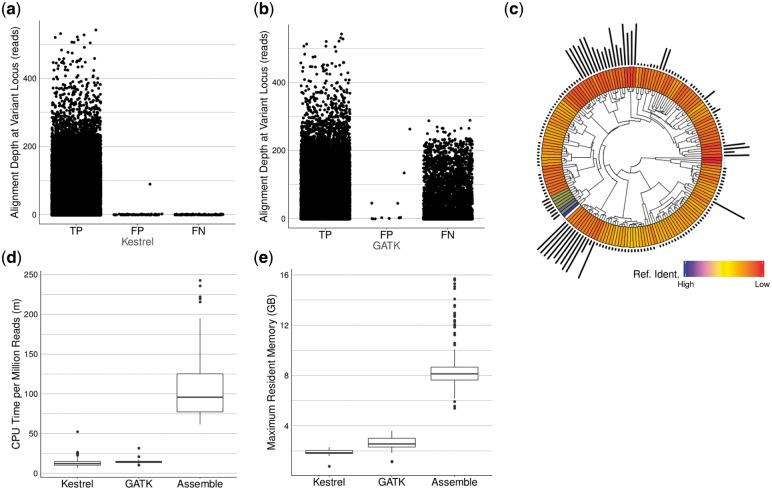
Fig. 3.
Results of testing Kestrel and the alignment approach using GATK over 173 S.pneumoniae samples. (a) Variant call summary for Kestrel calls depicting TP, FP, FN calls. (b) Variant call summary for GATK calls depicting TP, FP and FN calls. (c) A plot depicting the phylogeny of all samples by ANI (inner track), the distance from the reference (white) by ANI as a blue-yellow-red heatmap (middle track), and the relative number of variants in each sample (outer track). (d) CPU minutes per million reads. When an assembly is required, the required CPU time increases. (e) Maximum memory usage in gigabytes (GB) for each pipeline (Color version of this figure is available at Bioinformatics online.)

