
Fig. 4.
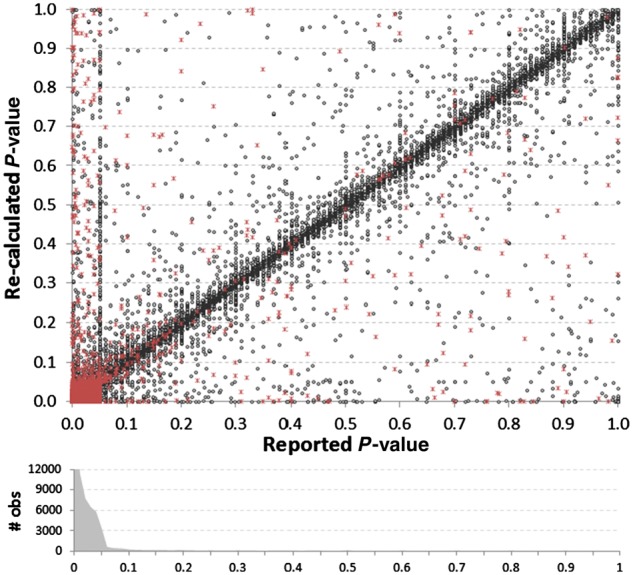
Comparison of reported P-values versus their recalculated values, based upon the reported 95% CIs. Red asterisks indicate instances where there was a discrepancy between the reported and recalculated ratio–CI, suggesting potential causality for a discrepancy. The density histogram shows the bias towards the reporting of low P-values, as 87% of all reported P-values were P ≤ 0.05. The histogram was truncated at 12 000 (36 420 reported P-values were ≤0.01). A vertical cluster of values can be seen where the reported P-value = 0.05