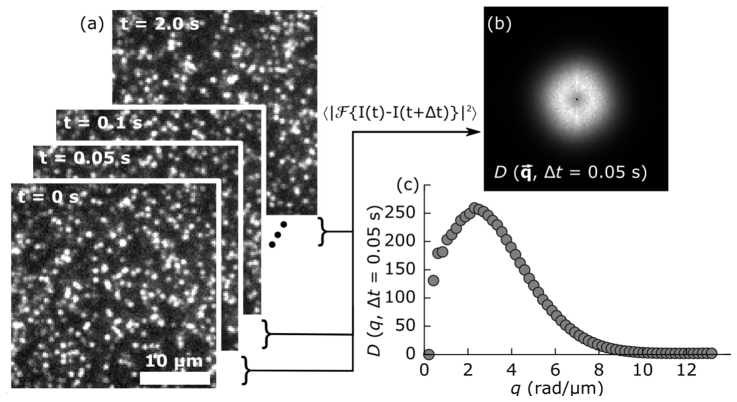
Fig. 2.
(a) A sequence of captured images is analyzed by subtracting each pair separated by a given lag time, Δt, taking the square of the Fourier transform, and averaging to produce the image structure function, shown in (b). (c) The radially averaged image structure function for Δt = 0.05 s. This procedure is then repeated for a range of lag times.

