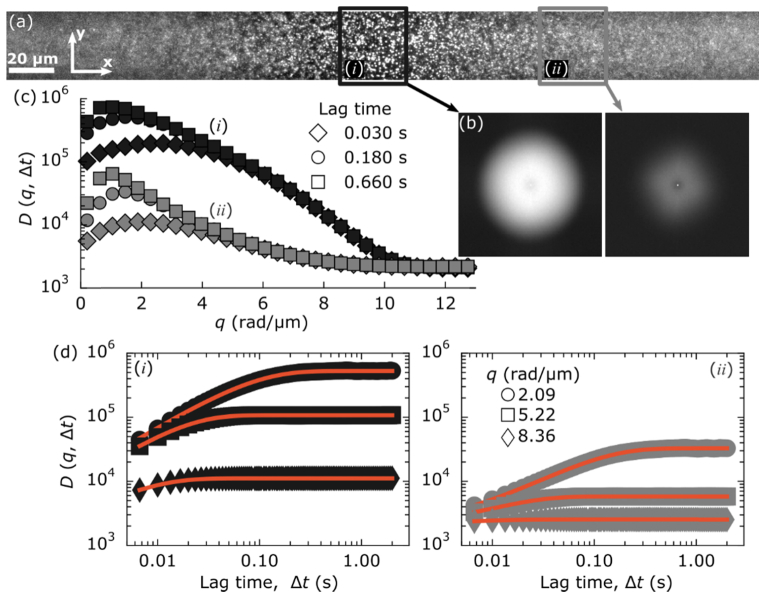
Fig. 3.
Images acquired of 200-nm fluorescent beads, φ = 10−3, with 1408 × 128 resolution are broken into eleven ROIs of 128 × 128 pixels and analyzed separately. (a) Full-field of view with two boxes highlighting different ROIs. The black box highlights the ROI (i) where the light-sheet is focused. The gray box highlights an ROI (ii) 90 µm upstream (w.r.t. the propagation of the excitation light-sheet). (b) The image structure functions, D(q,Δt), of the two ROIs are shown (identical intensity scaling). The 2D image structure functions are shown with a lag time of 0.03 seconds. (c) The radial average of D(q,Δt) for both ROIs is plotted as a function of wave-vector for three lag times: 0.03 s (diamonds), 0.18 s (circles) and 0.66 s (squares). (d) For both ROIs, D(q,Δt) is plotted as a function time lag for three separate spatial frequencies: 2.09 rad/µm (circle), 5.22 rad/µm (square) and 8.36 rad/µm (diamond). Red lines are fits to Eq. (2).

