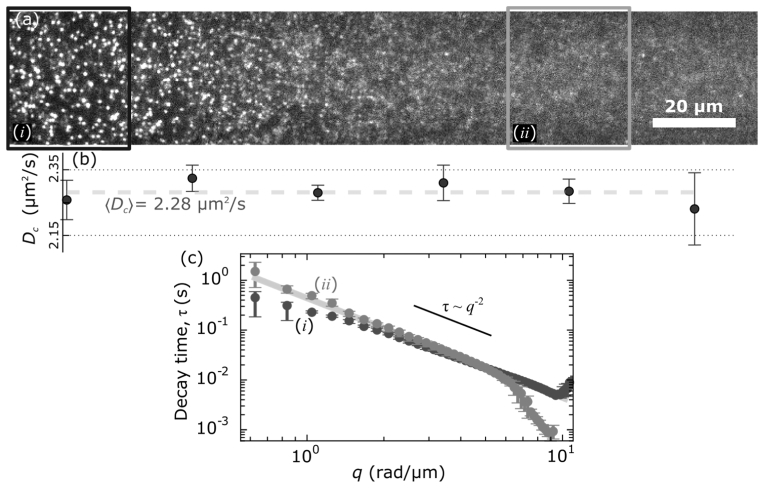
Fig. 4.
(a) Just over half of a full 1408 × 128 field-of-view shown of fluorescent beads with volume fraction φ = 4 × 10⁻⁴. The black box highlights an ROI (i) where the light-sheet is most focused and the gray box (ii) where the light-sheet is thicker (~30 µm versus ~4.5 µm). (b) Five movies of 4000 frames each and of 1408 × 128 resolution were recorded at 300 Hz. For each ROI of 128 × 128 pixels we determined the diffusion coefficient, Dc. We plot the mean Dc as a function of the ROI (corresponding with the image above) with error bars showing the standard deviation across the five movies. Across all ROIs we found Dc = 2.28 µm2/s ± 0.03 µm2/s. The larger uncertainty in Dc for the far right ROI, which is about ± 0.1 µm2/s, is likely due to the higher background. (c) The diffusion coefficients are found by determining where τm ∝ q–2 and calculating the average Dc = τm−1q–2 over that range. The solid gray line is τm = (2.28 µm2/s)−1 q–2. The darker points correspond to ROI i and follow the τm ∝ q–2 scaling from around q ~1.5 rad/µm to q ~10 rad/µm. The gray points correspond to ROI ii and follow τm ∝ q–2 from around q ~0.6 rad/µm to q ~5.5 rad/µm.

