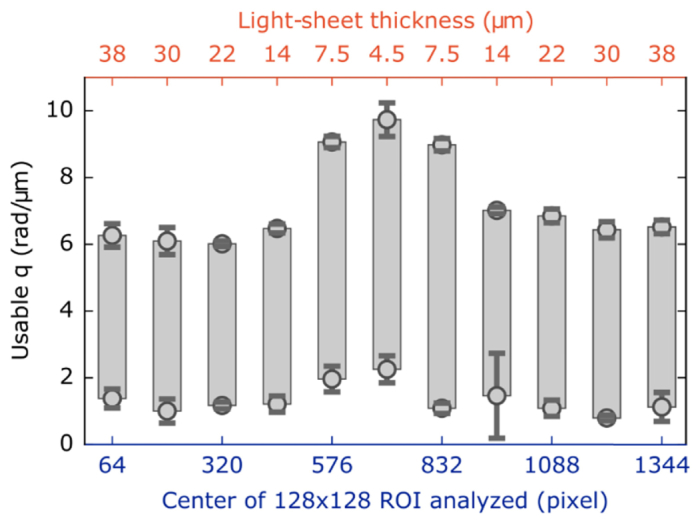
Fig. 5.

Five movies, each of 4000 images, with 1408 × 128 resolution are taken of fluorescent 200-nm beads of volume fraction φ = 10−3 (representative image shown in Fig. 3(a)). Each movie is divided into eleven 128 × 128 ROIs and for each we find the range of wave-vectors, q, where τm scales as q–2. We find that where the light-sheet is thinnest (our central ROI) the expected τm ∝ q–2 scaling holds for larger q-values though it departs from the scaling, on the low-q end, at greater values than in regions where the light-sheet is thicker. Error bars depict the standard deviation of where the τm ∝ q–2 scaling fails on the low and high ends across the five different movies.
