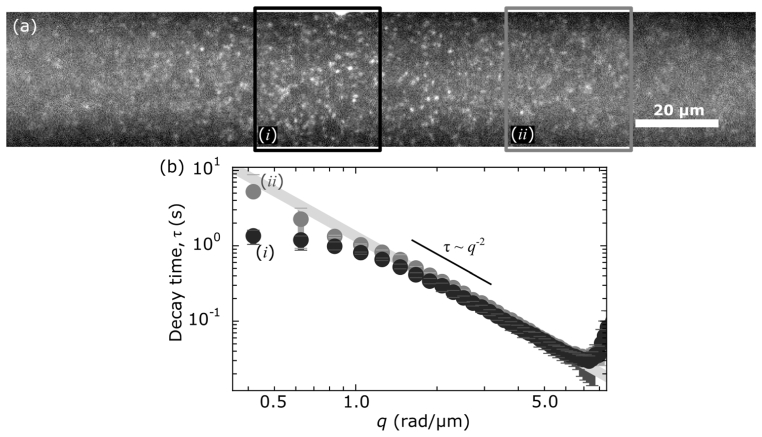
Fig. 7.
Labeled DNA in an aqueous buffer was analyzed with SPIDDM. (a) We recorded several movies of 4000 frames and 768 × 128 pixel resolution at 190 Hz. (b) We observe the same trend as with the colloidal suspension data. Analysis of images from the thinner regions of the light-sheet depart from the expected τ ∝ q–2 scaling, on the low-q end, at greater q than regions where the light-sheet is thicker. Our data does not follow the τ ∝ q–2 for as high a wave-vector (typically ~7 rad/ µm) as the data with the colloidal suspension. This is likely due to decreased signal-to-noise as the DNA molecules have fewer dyes molecules than the beads and excitation power had to be minimized to avoid photobleaching. The solid gray line shows τ = Dcq–2 for Dc = 0.72 µm2/s.

