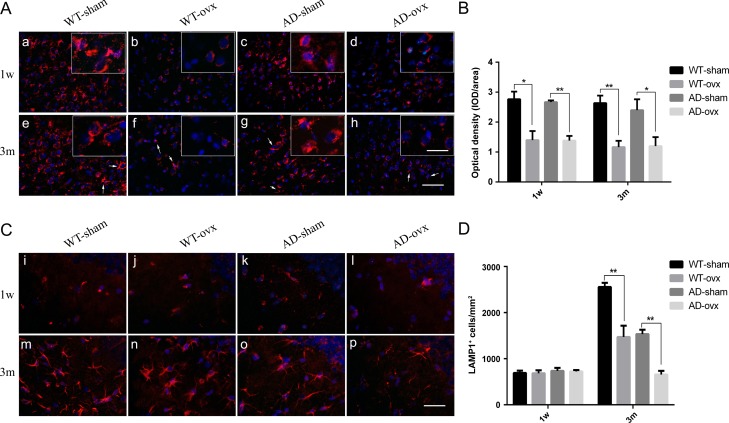
Figure 7.
Expression of LAMP1 in the mouse brain (A) Expression of LAMP1 in the cortex of mice 1 week and 3 months after ovariectomy. Upper panels represent 1 week after ovariectomy (a–d). The other panels represent 3 months after ovariectomy (e–h). (B) Quantification of LAMP1 in the cortex showed a significant decrease in both ovariectomized WT and 2×TgAD mice compared with that in the sham mice. (C) Expression of LAMP1 in the hippocampus 1 week and 3 months after ovariectomy. Upper panels represent 1 week after ovariectomy (i–l). The other panels represent 3 months after ovariectomy (m–p). (D) Quantification of LAMP1 in the hippocampus showed a significant decrease in LAMP1 expression in both ovariectomized WT and 2×TgAD group mice compared with that in sham mice. Nuclei are stained blue with DAPI. Arrows indicate filamentous patterns for LAMP1 in the cortex. Scale bar in picture A: 50 μm; inset: 20 μm; picture C: 30 μm. Data are presented as the mean ± SEM. *P < 0.05 and **P < 0.01.

