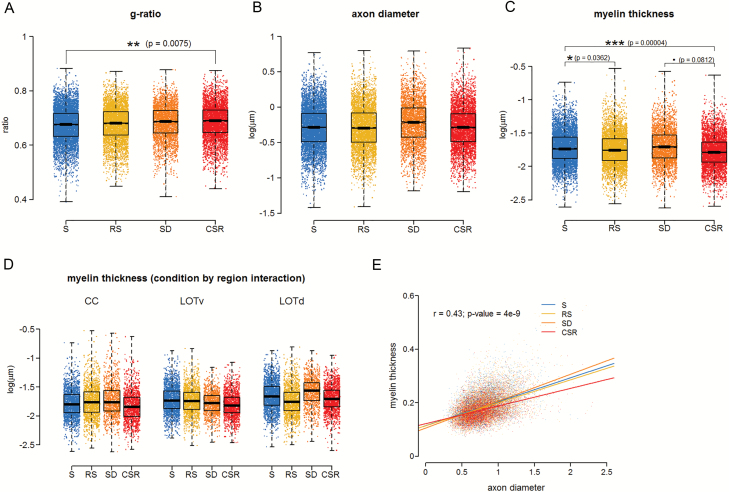
Figure 2.
Myelin thinning occurs after chronic sleep loss. (A)–(C) Distribution of g-ratio (A), axon diameter (B), and myelin thickness (C) measurements for S (three mice, 5918 axons), RS (three mice, 4593 axons), SD (two mice, 3045 axons), and CSR (three mice, 4338 axons). For axon diameter and myelin thickness, a log transformation has been applied to raw values, so the units are log(µm). (D) Myelin thickness by region interaction showing that the effect of sleep loss on myelin thickness varies depending on the region. (E) Graph showing the effect of axon diameter on myelin thickness for each of the different sleep conditions, including linear regression of myelin thickness on axon diameter (bold lines) and individual observations (dots). As there was no significant interaction between condition and axon diameter, the r and p values refer to the regression line considering all conditions together. Note that the axes in (A), (C), and (D) are not zeroed.

