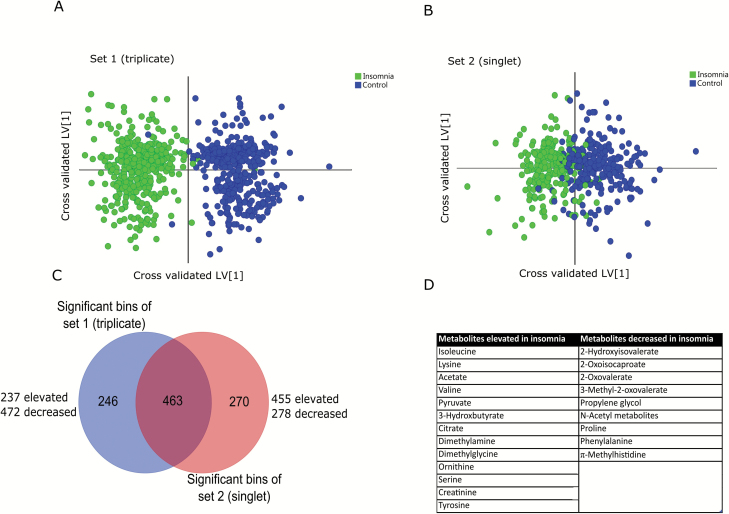
Figure 3.
Multivariate OPLS-DA analysis of insomnia and control samples over all collection time points. Cross-validated OPLS-DA scores plot showed significant clustering of insomnia and control samples over both triplicate (A) and singlet (B) sets. The bins were selected by overlap analysis (C) and metabolites were assigned by spectral profiling (D).

