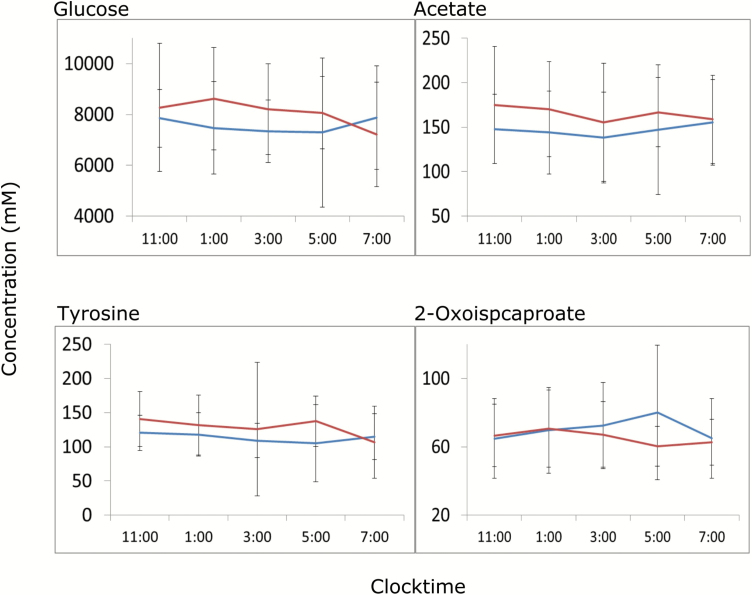
Figure 5.
Time series analysis of metabolites. Only the second night data are shown here. The samples were analyzed by two-group SAM for significantly different temporal trend of metabolites in insomnia (red) and control (blue) population. Metabolites with significant differences across control and insomnia population are presented.

