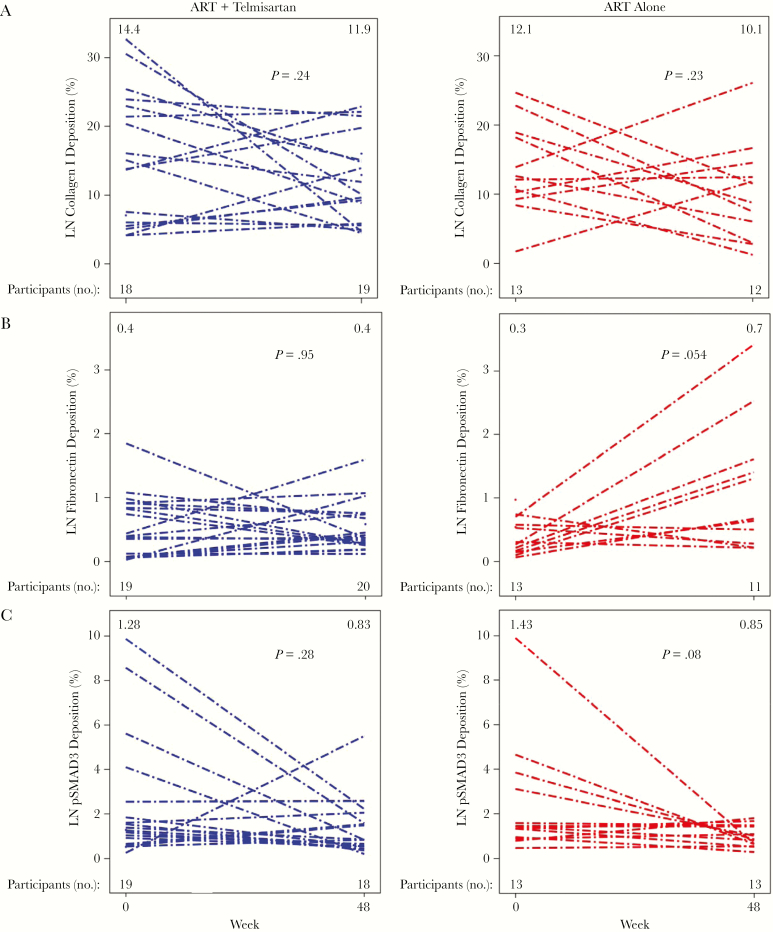
Figure 3.
Fibrosis in lymph node (LN) biopsy specimens. A, Collagen I deposition in LN specimens was dynamic, with most participants experiencing a decrease regardless of study arm. B, LN fibronectin deposition increased in the control arm but not in the telmisartan arm. C, Phosphorylated SMAD3 (pSMAD3), a marker of transforming growth factor β signaling, decreased with continued ART, with no additional decrease with telmisartan. No significant differences were seen in changes over time between telmisartan and control groups. Within-group changes over time were secondary end points. Each line represents a single participant. The median value for each tissue at each time point is indicated at the top of each figure. The number of participants with evaluable samples at each time point for each marker is indicated at the bottom of each figure. P values reflect within-arm differences between weeks 0 and 48 and were determined by the Wilcoxon signed rank test.

