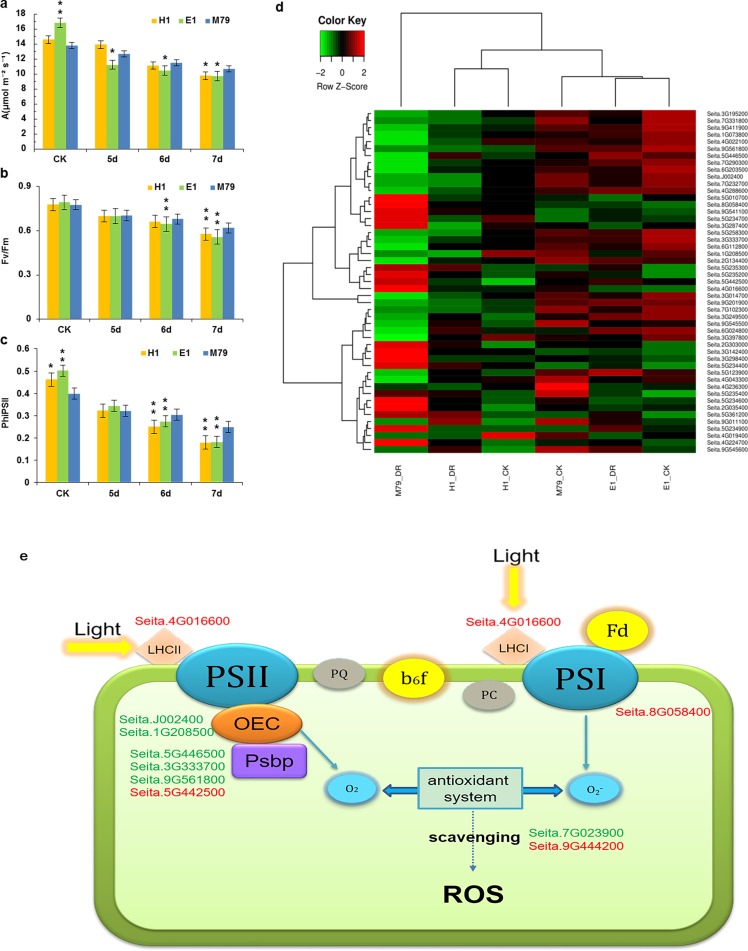
Figure 6. Photosynthetic analysis of drought-stressed M79, E1 and H1.
(A) A (µmol m −2 s −1) of M79, E1 and H1 under normal conditions and 5–7 days after drought treatment; (B) Fv/Fm of M79, E1 and H1 under normal conditions and 5–7 days after drought treatment; (C) ΦPSII of M79, E1 and H1 under normal conditions and 5–7 days after drought treatment; (D) clustered heatmap showing photosynthetic DEGs in drought-stressed M79, E1 and H1 (E) photosynthetic pathways in drought-tolerant M79. Red and green indicate the up- and down-regulated DEGs, respectively, in response to drought stress. Data are presented as means ± SD (n = 5); *, significance levels in comparisons with M79 were determined by t-tests (* P < 0.05, ** P < 0.01).

