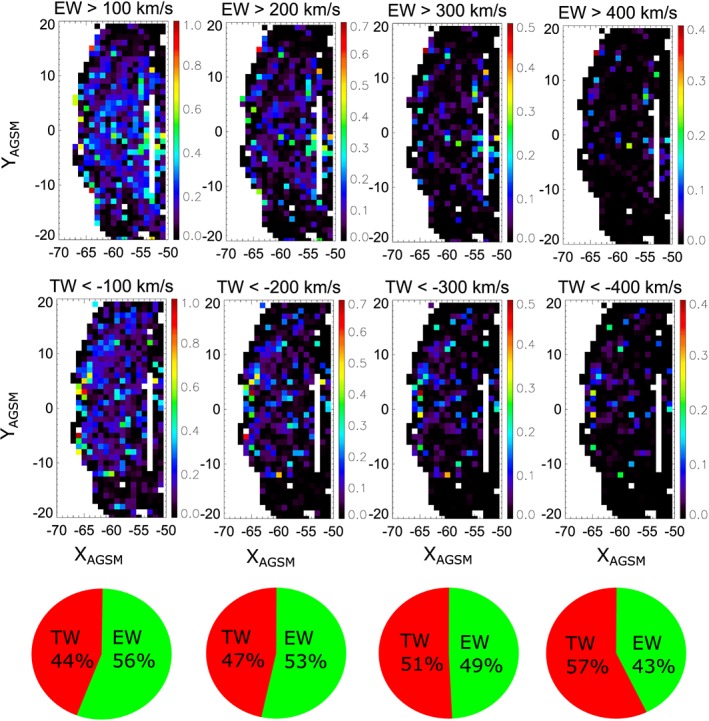
Figure 3.

Occurrence rate of (top row) earthward and (middle row) tailward flow data points for different velocity thresholds (columns) and (bottom row) partition of flow direction. The occurrence rate is defined as the number of flow data points in each bin, normalized to all data points P1 collected in the corresponding bin. Only flow data points exceeding the defined thresholds are selected for the corresponding data set. The values in the pie charts show the percentage of flow data points beyond the given threshold which are directed tailward and earthward, respectively.
