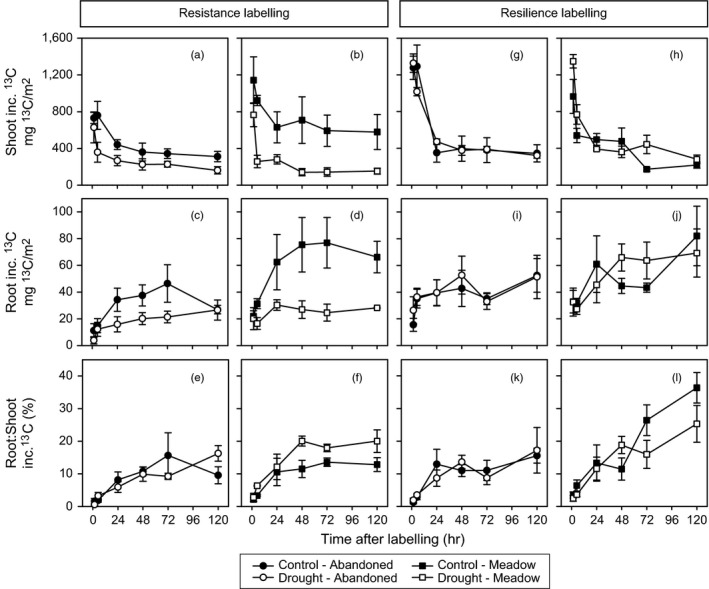
Figure 1.

13C tracer dynamics in bulk shoots and roots as well as the root to shoot 13C ratio over time from abandoned grassland (a, c, e, g, i, k/circles) and meadow (b, d, f, h, j, l/squares) control (closed symbols) and drought (open symbols) monoliths; after the resistance (a–f) and the resilience (g–l) 13C pulse labelling. Error bars show ± SE (n = 3); inc. 13C, incorporated 13C
