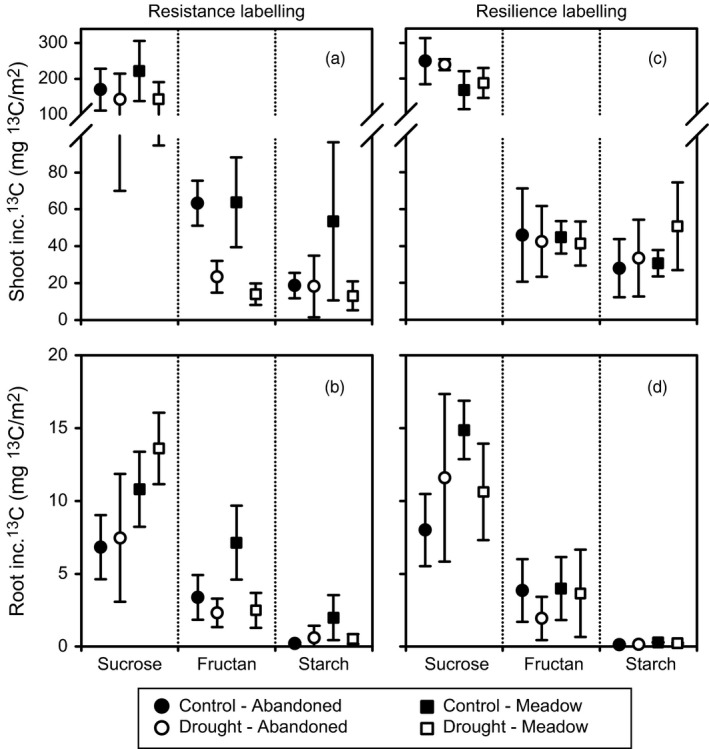
Figure 2.

Average 13C tracer incorporation into plant shoot (a, c) and root (b, d) carbohydrates of control (closed symbols) and drought (open symbols) monoliths from the abandoned grassland (circles) and the meadow (squares); after the resistance (a, b) and the resilience (c, d) 13C pulse labelling. Dotted lines separate amongst the three investigated carbohydrates (sucrose, fructan and starch). Error bars show ± SE (n = 3); inc. 13C, incorporated 13C
