
Figure 2.
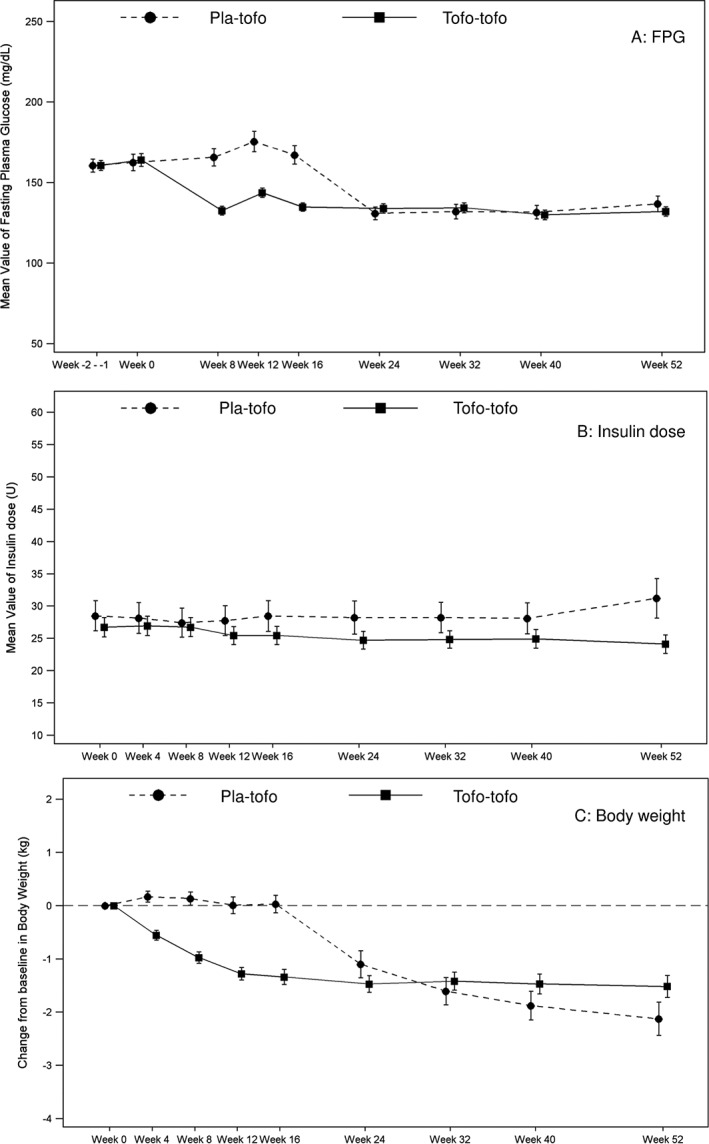
Plot of mean value of FPG and insulin dose, and plot of mean change in body weight (C) by visit (mITT population). Patients who received tofogliflozin in both the double‐blind and extension phases were referred to as the ‘tofo‐tofo group’, and patients who received placebo in the double‐blind phase and tofogliflozin in the extension phase were referred to as the ‘pla‐tofo group’. (A–B) mean ± SE of FPG and insulin dose. (C) mean change ± SE in body weight. The graph includes data obtained from the first dose of tofogliflozin or placebo during the entire treatment period or up to introduction of the rescue medication, 1 day after the last dose of the tofogliflozin or placebo, whichever is the earliest. Abbreviations: FPG, fasting plasma glucose; mITT, modified intention‐to‐treat; SE, standard error