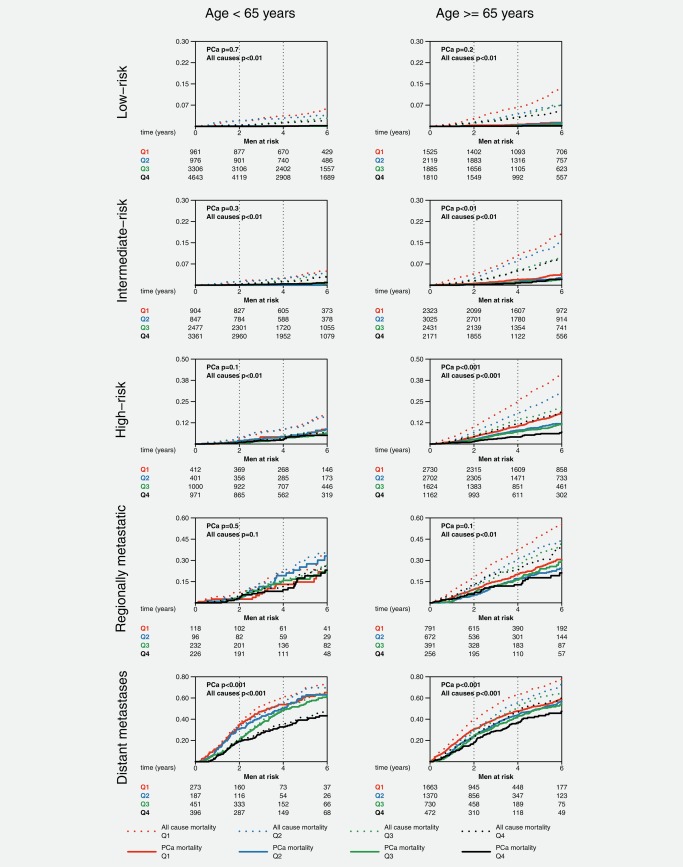
Figure 2.

Prostate cancer and all‐cause mortality by income, age and prostate cancer risk category in men with Charlson Comorbidity Index 0.
Pca: prostate cancer; Quartile of disposable income: Q1 lowest – Q4 highest; Risk categories: very low‐risk (T1c, Gleason score (GS) ≤6, Prostate‐specific antigen (PSA) <10 ng/ml, PSA density < 0.15, number of biopsy cores positive for cancer ≤4, cancer extension at biopsy <8mm), intermediate‐risk (T1‐2, GS 7 and/or PSA 10 to <20 ng/ml), high‐risk (T3 and/or GS 8–10 and/or PSA 20 to <50ng/ml), and very high risk (T4, PSA 50 to <200 ng/ml, any N stage, M0); p from Gray's test.
