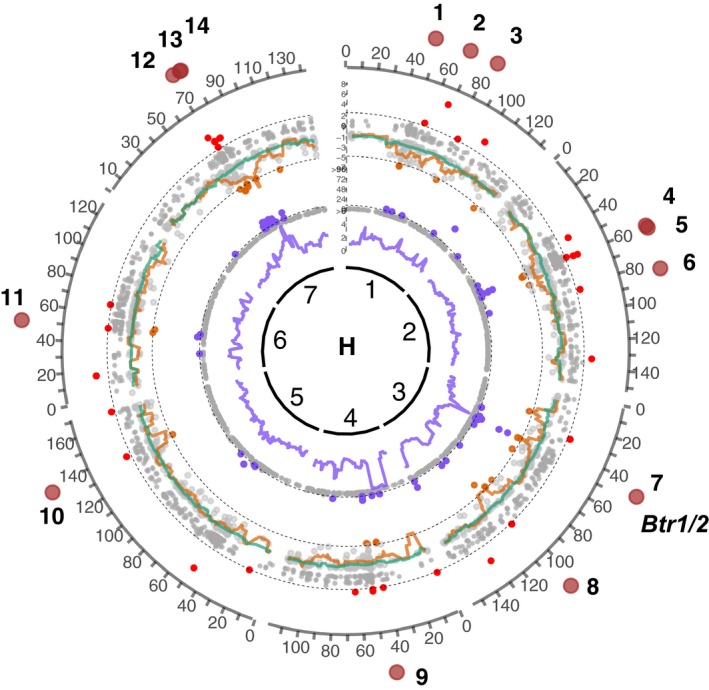
Figure 2.

Genomic signatures of domestication selective sweeps (Beier_2017 map). Genome scans for signatures of selection associated with domestication. The sliding‐window and individual‐target values are shown as lines and points, respectively. The innermost circle represents barley linkage groups (H) followed by the diversity reduction index (π wild/π dom) (violet); the normalized Fay&Wu's H norm statistics for the wild (green) and domesticated (orange) groups; and the composite likelihood ratio statistics (sweeD CLR) for the domesticated group (red). The outlier thresholds are shown by dashed lines and the nonoutlier loci are shown as gray dots for all the tests. Fourteen candidate selected regions supported by at least two of the statistics are shown as brown circles on the outermost layer. Btr1/2, brittle rachis domestication genes (Pourkheirandish et al., 2015).
