
Figure 3.
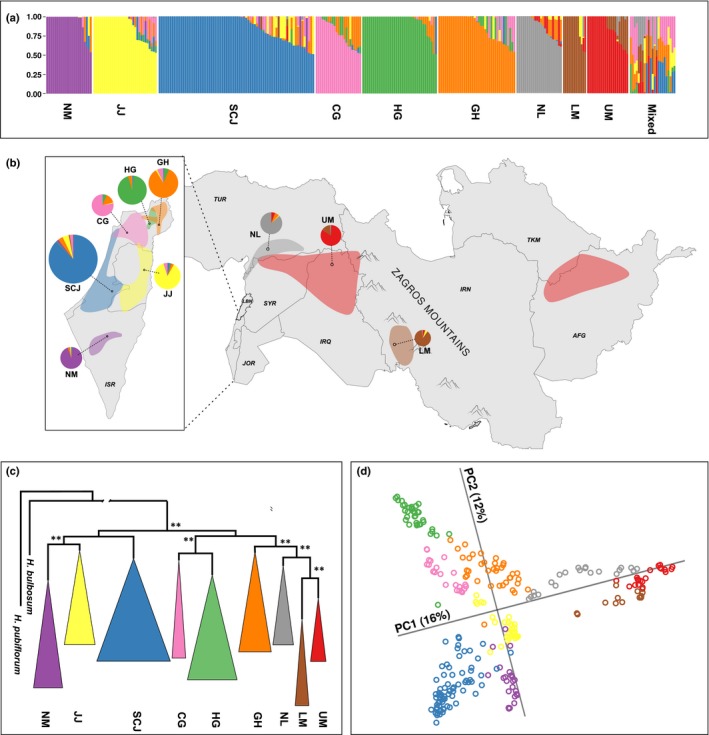
Geographic distribution, structure and phylogeny of nine wild barley (Hordeum vulgare ssp. spontaneum) populations. The colors correspond to the nine wild barley populations: Carmel & Galilee (CG, pink); Golan Heights (GH, orange); Hula Valley & Galilee (HG, green); Judean Desert & Jordan Valley (JJ, yellow); Lower Mesopotamia (LM, brown); Negev Mountains (NM, magenta); North Levant (NL, gray); Sharon, Coastal Plain & Judean Lowlands (SCJ, blue); and Upper Mesopotamia (UM, red). (a) Population structure of wild barley as determined by faststructure for K = 9. Vertical bars correspond to individual genotypes and colors indicate their membership in the nine subpopulations. (b) Distribution of the wild barley populations within the Fertile Crescent. The pie charts represent the ancestral composition of the populations as determined by faststructure and are connected to the geographic centers of population distributions by dashed lines. The size of the pie charts reflects the number of genotypes in the populations. The country codes (ISO 3166) are shown in italics. (c) The maximum likelihood phylogeny of wild barley accessions (faststructure single population ancestry component > 95%). The clusters were collapsed based on the population assignment. Hordeum bulbosum and Hordeum pubiflorum were used as distant outgroup species and the length of the outgroup branch was artificially shortened. The branches with the bootstrap support values > 0.6 are labeled by double asterisks. (d) Principal component (PC) analysis of wild barley accessions (faststructure single population ancestry component > 95%). Only first two PCs are shown. A percentage of the total variation explained by the PCs is shown in parentheses.