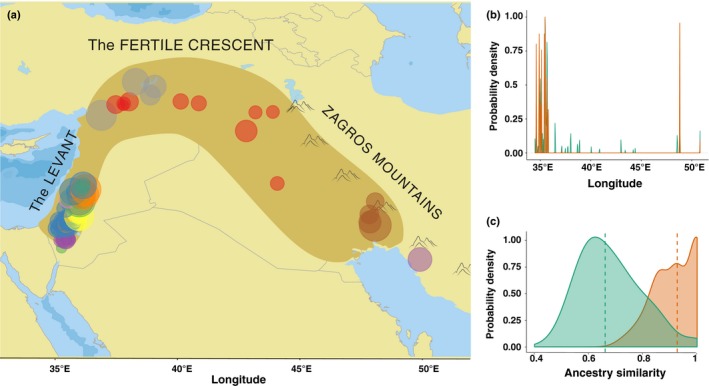
Figure 4.

Origin and ancestral composition of the domesticated barley genomes. (a) Geographic distribution of wild barley accessions, which carry ancestral haplotypes of the domesticated barley (Hordeum vulgare ssp. vulgare) loci, within the Fertile Crescent. The colors correspond to the nine wild barley (H. vulgare ssp. spontaneum) populations: Carmel & Galilee (pink); Golan Heights (orange); Hula Valley & Galilee (green); Judean Desert & Jordan Valley (yellow); Lower Mesopotamia (brown); Negev Mountains (magenta); North Levant (gray); Sharon, Coastal Plain & Judean Lowlands (blue); and Upper Mesopotamia (red). (b) Longitudinal distribution of the ancestral wild haplotypes for the neutral (green) and domestication sweep loci (orange) shown as kernel density plots. (c) Distribution of the pairwise ancestry similarity coefficients estimated for the neutral (green) and domestication sweep loci (orange) shown as kernel density plots. The vertical dashed lines indicate the median similarity values for the corresponding subgroups.
