
Figure 2.
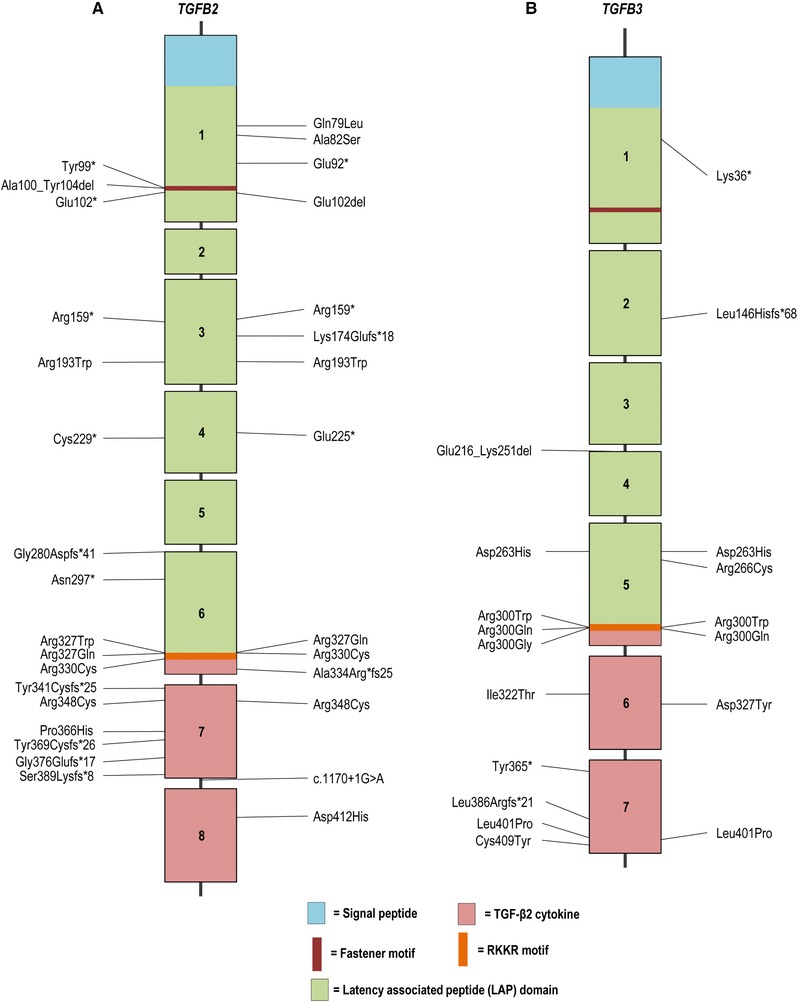
Schematic representation of the TGFB2 and TGFB3 gene with their protein coding domains. Boxes represent exons 1–8 and 1–7, respectively. On the left side of the schematic are the previously reported mutations, whereas on the right side mutations identified in this study are described. Mutations are annotated at the protein level (reference transcript: NM_001135599.2 for TGFB2 and NM_003239.3 for TGFB3)