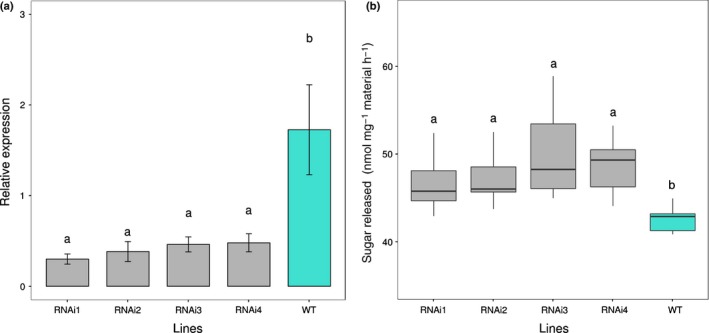
Figure 5.

Analysis of the RNAinterference (RNAi) transgenic straw. (a) Transcript abundance indicated by the bar plot of the means for each level of independent variable of ANOVA showing ± SE. Tukey's honest significant difference (HSD) test indicates that those sharing the same letter are not significantly different. (b) Saccharification in silenced lines shown as boxplots to highlight the mean (line), 25th–75th percentile (box) and 10th–90th percentile (whiskers) of the glucose released for each genotype. Tukey's HSD test indicates that those sharing the same letter are not significantly different.
