
Figure 2.
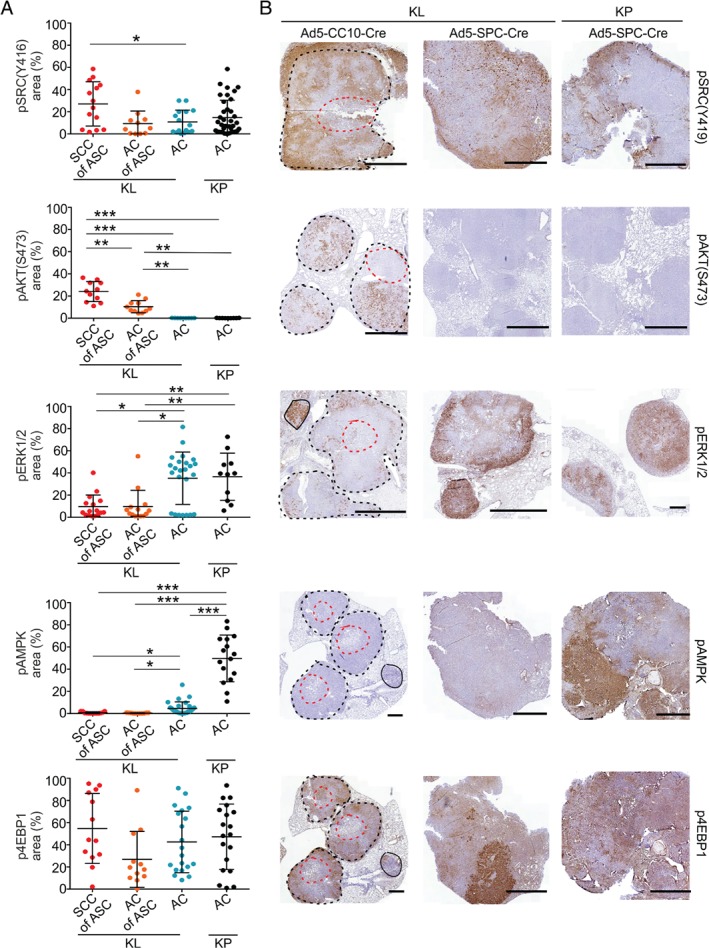
Oncogenic signalling pathway phosphoproteins show heterogeneous spatial distribution in KL and KP NSCLCs. (A) Quantified expression (percentage of tumour area stained) of pSRC(Y416), pAKT(S473), pERK1/2, pAMPK and p4EBP1 in Ad5‐CC10‐Cre‐induced KL SCC or AC of ASC tumour regions and Ad5‐SPC‐Cre‐induced KL or KP AC tumours. Each dot represents a tumour (11–29 tumours from seven mice for KL ASC, and five mice each for KL and KP AC), and lines and whiskers indicate mean ± standard deviation of the average values of individual tumours per histotype group. Significance was assessed with t‐tests (average per mouse was used as an experimental unit): *p < 0.05, **p < 0.01, ***p < 0.001. (B) IHC images of stained tumours induced by Ad5‐CC10‐Cre (KL) or Ad5‐SPC‐Cre (KL and KP); one image for each of the phosphoproteins and lesion groups is shown by a beeswarm plot in (A). For Ad5‐CC10‐Cre KL tumours, the solid line indicates mucinous AC, and black and red dotted lines define outer SSCs and inner AC cores of ASCs, respectively. Scale bars: 1 mm.