Figure 3.

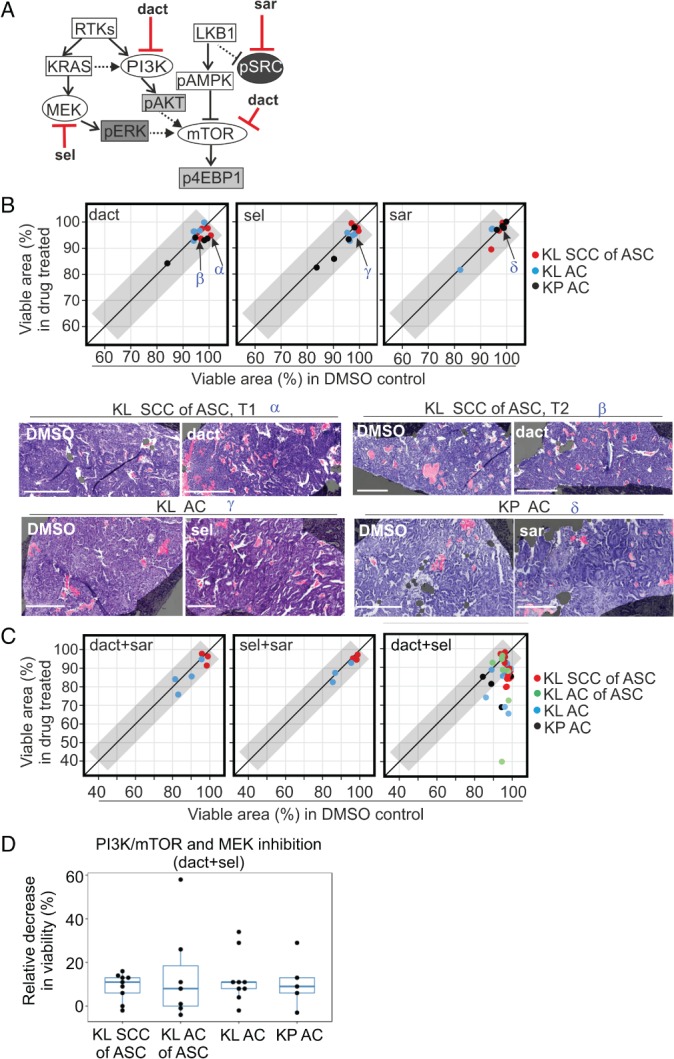
KL and KP tumour slices show cytotoxic responses to combined targeting of the MAPK and PI3K–mTOR pathways. (A) Signalling diagram depicting molecular compounds and their targets utilised in this study. (B) Responses following 24 h of treatment with single compounds: 0.5 or 1 μm dact, 0.5 μm sel, or 1 μm sar. The viable tissue area (percentage of tumour area) in drug‐treated slices is correlated with the viable area in neighbouring DMSO‐treated controls. The diagonal line corresponds to equal viability, and the grey area corresponds to the region with <5% difference between treated and control slices. Representative H&E images of matching DMSO‐treated and drug‐treated slices are shown; regions of cell death are pseudo‐masked in pink, and viable areas in purple. Scale bar: 300 μm. Greek letters (α, β, γ, δ) and arrows in the scatterplot indicate the tumours shown in the images. KL ASC samples represent data measured in larger SCC histotype regions; no visible response was detected in core KL ACs of ASC regions. (C) Correlation of viable tissue area in drug‐treated and matching DMSO control slices (percentage of total tumour area) in KL and KP tumours following 24 h of combination treatment with dact + sar (0.5 or 1 μm + 1 μm), sel + sar (0.5 μm + 1 μm), or dact + sel (0.5 or 1 μm + 0.5 μm). Of these, only the dact + sel combination elicited cytotoxicity, which was quantified for the four histotype groups. (D) Comparison of drug responses after 24 h of dact + sel treatment in the four different histotype groups: decrease in viability (%) measured as the ratio of the viable area in the drug‐treated slice and the matching DMSO control. One‐way anova was used for statistical comparison.
