
Figure 4.
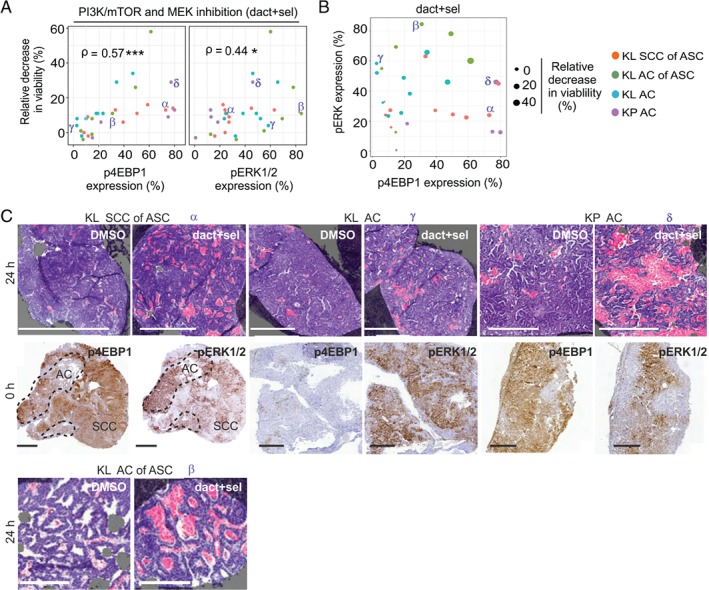
Oncogenic signalling activities at treatment onset correlate with dact + sel combination treatment responses. (A) Drug responses following 24 h of dact + sel treatment in slices representing KL SCC of ASC, KL AC of ASC, KL AC and KP AC tumour tissue, plotted against expression (percentage of tumour area) of p4EBP1 or pERK1/2, indicating targeted pathway activities in source tumours at treatment onset. Viability following drug treatment is depicted as relative decrease in viability (%). Spearman coefficients (ρ) are indicated with significance: *p < 0.05, ***p < 0.001. Greek letters (α, β, γ, δ) indicate tumour samples shown in (C). (B) Scatterplot depicting the correlation of pERK (y‐axis) and p4EBP1 (x‐axis) at treatment onset in relation to the relative decrease in viability (%; balloon size) in dact + sel‐treated slices after 24 h. The four tumour groups are indicated by colours; α, β, γ, δ indicate the tumour samples shown in (C). (C) Selected phosphoprotein expression and drug response data from slice experiments plotted in (A) and (B), indicated by Greek letters (α, β, γ, δ). Shown are representative images of H&E‐stained sections with masks for dead (pink) and viable (purple) tissue, and IHC stains of p4EBP1 and pERK in the corresponding 0‐h slices. Scale bars: 500 μm (top row) and 300 μm (bottom row).