
Figure 5.
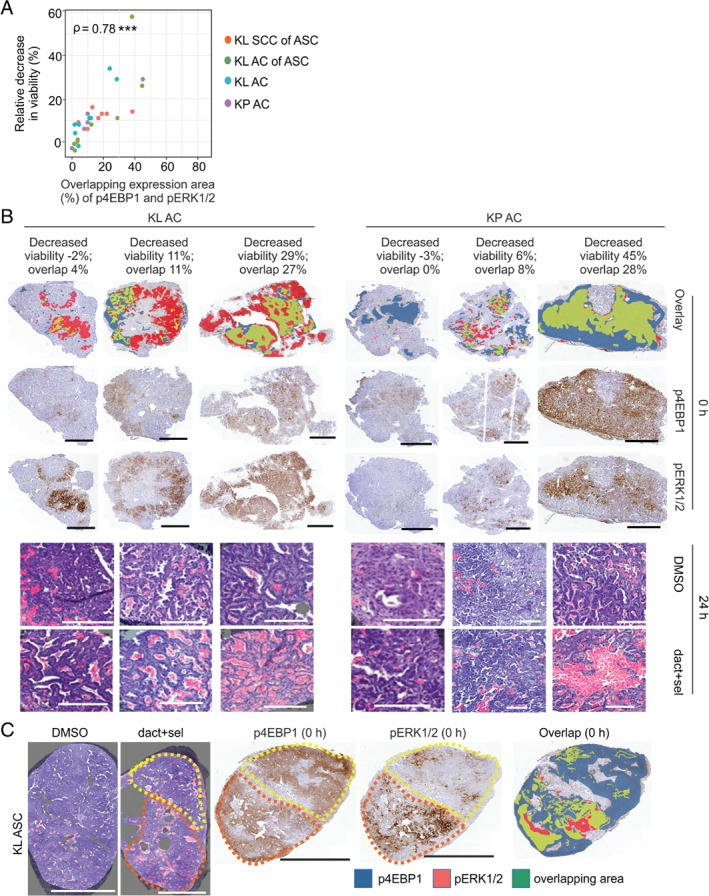
Combination treatment response is determined by spatial distribution of the targeted pathway activities in tumour slices. (A) Correlation of dact + sel treatment with the areas of p4EBP1 and pERK overlap (%) in neighbouring 0‐h slices in the four different tumour groups. Drug response depicted as relative decrease in viability (%) is measured as the ratio of quantified viable area in drug‐treated and corresponding DMSO‐treated controls. Spearman coefficients (ρ) are indicated with significance: *p < 0.05. (B) IHC images depicting p4EBP1 expression (blue), pERK expression (red) or their overlapping expression (green) at 0 h in three KP or KL AC tumours selected from the data plotted in (A) and (B). H&E images of drug‐treated and matching DMSO‐treated controls are pseudo‐marked to indicate dead (pink) and viable (purple) areas. Scale bars: 1 mm (immunohistochemistry) and 200 μm (H&E). (C) H&E images of DMSO‐treated or dact + sel‐treated slices showing dead (pink) and viable (purple) areas of a KL SCC of an ASC tumour selected from the data plotted in (A) and (B). IHC images depicting p4EBP expression (blue), pERK expression (red) or their overlapping expression (green) at treatment onset. The yellow dotted line outlines an area with low cytotoxicity (H&E image), lower pERK expression (IHC image) and lower phosphoprotein overlap than in the area marked by the orange dotted line. Scale bars: 500 μm.