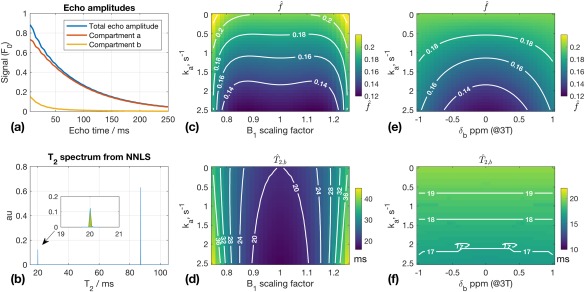
Figure 4.

Results from Test 2. a: Example echo amplitudes for ka = 2s−1 B1 scaling = 1.1; both compartments are shown, but only the total echo amplitude would be observed experimentally. b: T2 spectrum from data in (a) obtained using nonnegative least square (NNLS). Inset plot shows shorter T2 peak; = 20.0 ms, = 0.133 (obtained from peak area, shaded). c, d: and as functions of ka and B1 scaling; is primarily a function of ka. When ka = 0, is estimated correctly; otherwise, tends to be systematically underestimated. is primarily a function of B1 scaling. e, f: and as functions of ka and ( depends on ).
