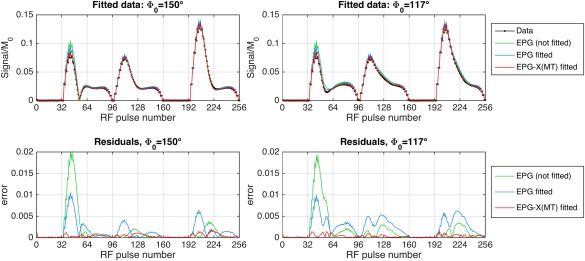
Figure 7.

Result of fitting EPG and EPG‐X(MT) models to the BSA phantom data. Both values of were fit simultaneously. Top row: Fits for both values of . Bottom row: Residuals. T2, D, and scaling factors were held fixed at experimentally measured values. For EPG‐X(MT), the ka, T1,a, T1,b, f, and G(0) were varied; the best‐fit parameters were ka = 6.2 s−1, T1,a = 1763 ms, T1,b = 363 ms, G(0) = 29.4 µs, f = 0.100, which would yield = 1283 ms. For single‐compartment EPG, the T1 was varied; the best fit was 1215 ms. The NRMSE before fit = 9.8%, single‐compartment EPG fit = 6.9%, EPG‐X = 1.3%.
